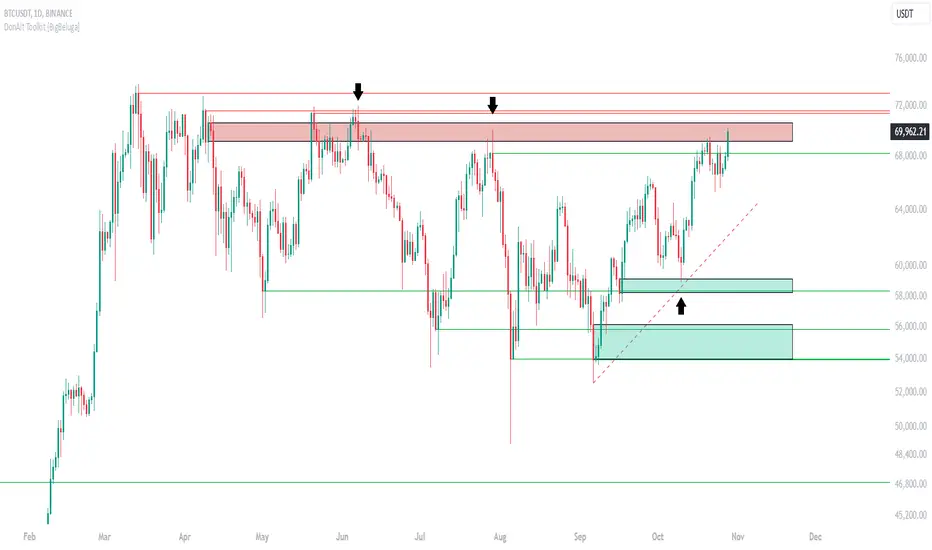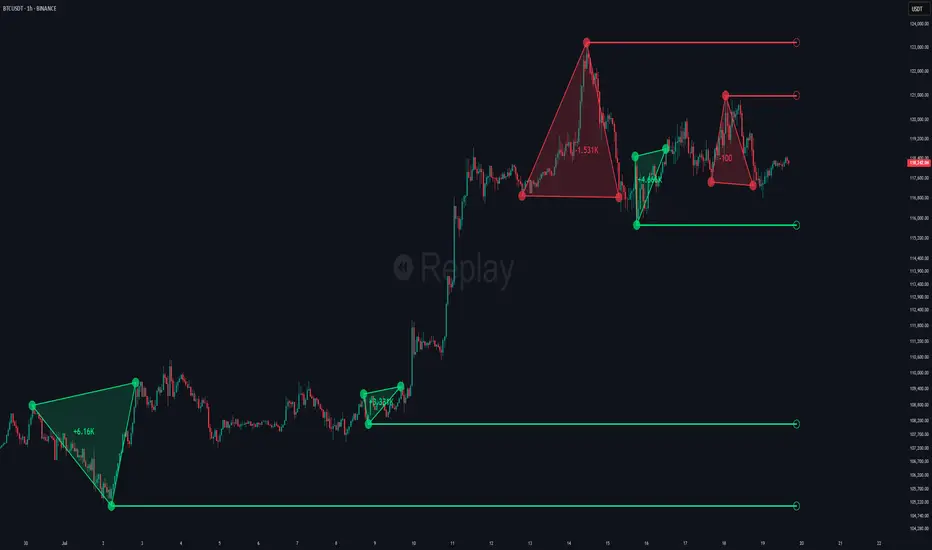
What this TradingView script does
Trading Toolkit is a comprehensive indicator inspired by the trading strategies of the renowned crypto influencer Michaël van de Poppe. This tool combines RSI divergences, correction zones, and advanced support/resistance levels to provide traders with a robust framework for analyzing market movements.
🔵Key Features:
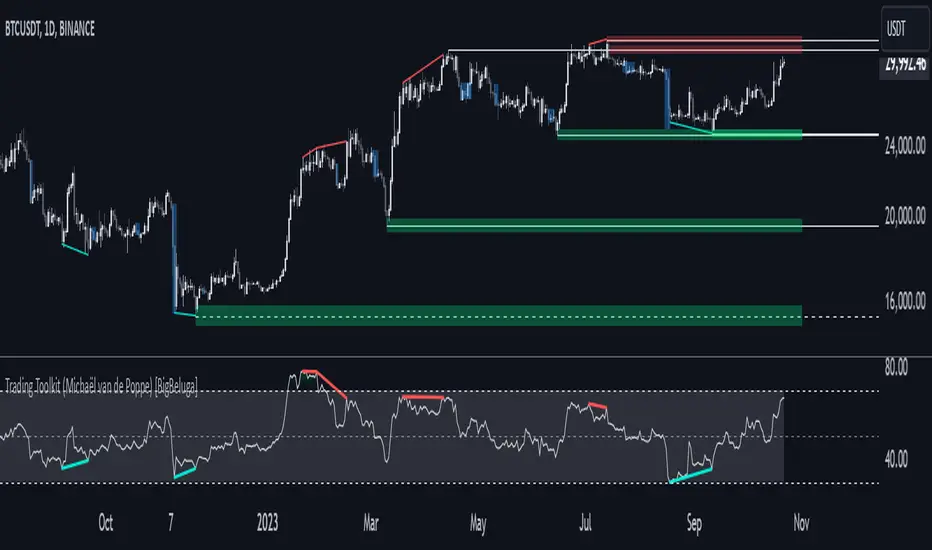
- RSI Divergences on Chart:
- Automatically identifies and plots RSI divergences (bullish and bearish) directly on the main price chart.
- Green lines indicate bullish divergences, suggesting potential upward reversals.
- Red lines indicate bearish divergences, signaling possible downward movements.
- Correction Boxes:
- Traders typically define a correction as a drop in value of 10% or more. This drop can happen over a few hours or a few days. Also, it can last for less than 24 hours or many months.
- This indicator visualizes corrections with blue shaded boxes, triggered by a percentage decline defined in the settings.
- The boxes highlight sharp price drops, helping traders identify significant market movements quickly.
- Advanced Support and Resistance Levels:
- Dynamically detects key support and resistance levels based on price pivots.
- When the price is above a level, it plots a green shaded area from the cross point, marking support.
- When the price drops below a level, it plots a red shaded area, highlighting resistance.
- Dashed lines indicate weaker levels, while solid lines represent stronger, more reliable levels.
🔵Usage:
- Identify Divergences: Use plotted RSI divergences to detect potential market reversals and align them with price action.
- Analyze Correction Zones: Utilize correction boxes to evaluate significant price declines and find potential buying opportunities during these corrections.
- Leverage Support and Resistance Levels: Confirm breakouts, reversals, or consolidation zones with the color-coded areas.
How traders can use it
Use Comprehensive Trading Toolkit as a chart context layer inside TradingView: read the structure it highlights, compare it with your market bias, and let the script narrow which moves deserve attention.
The strongest workflow is to combine the script with higher timeframe structure, volume context, and a repeatable execution plan instead of treating any single label as a standalone trade.