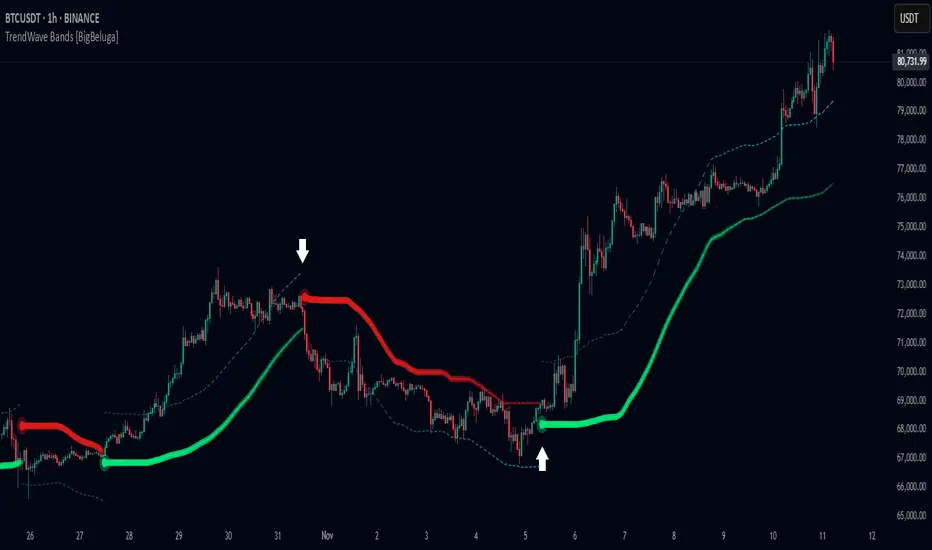
What this TradingView script does
This indicator utilizes logarithmic regression to track price trends and identify overbought and oversold conditions within a trend. It provides traders with a dynamic channel based on logarithmic regression, offering insights into trend strength and potential reversal zones.
🔵Key Features:
- Logarithmic Regression Trend Tracking: Uses log regression to model price trends and determine trend direction dynamically.
f_log_regression(src, length) =>
float sumX = 0.0 float sumY = 0.0 float sumXSqr = 0.0 float sumXY = 0.0
for i = 0 to length - 1 val = math.log(src) per = i + 1.0 sumX += per sumY += val sumXSqr += per * per sumXY += val * per
slope = (length * sumXY - sumX * sumY) / (length * sumXSqr - sumX * sumX) average = sumY / length intercept = average - slope * sumX / length + slope
- Regression-Based Channel: Plots a log regression channel around the price to highlight overbought and oversold conditions.
- Adaptive Trend Colors: The color of the regression trend adjusts dynamically based on price movement.
- Trend Shift Signals: Marks trend reversals when the log regression line cross the log regression line 3 bars back.
How traders can use it
Use Logarithmic Regression Channel-Trend as a chart context layer inside TradingView: read the structure it highlights, compare it with your market bias, and let the script narrow which moves deserve attention.
The strongest workflow is to combine the script with higher timeframe structure, volume context, and a repeatable execution plan instead of treating any single label as a standalone trade.