

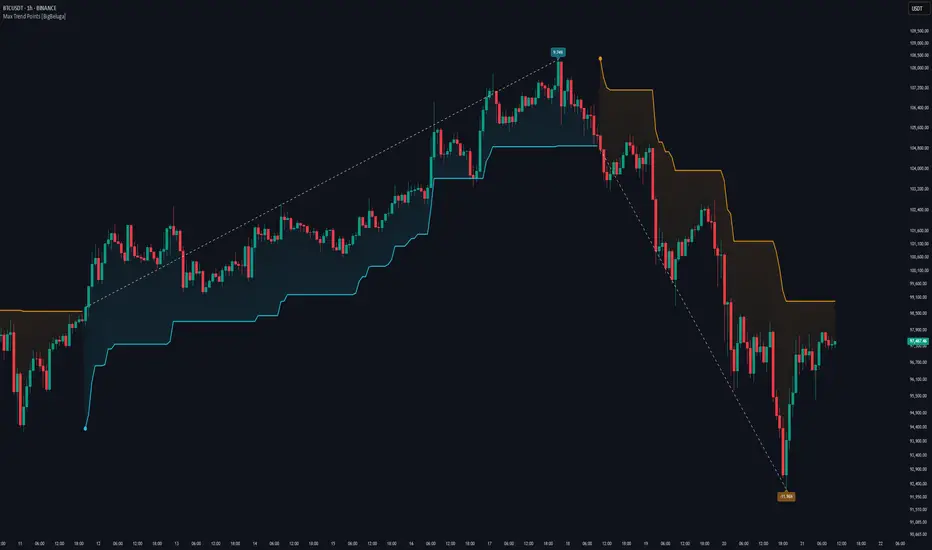
What this TradingView script does
A clean and powerful tool for identifying major trend shifts and quantifying the strength of each move using dynamically calculated price extremes.
This indicator helps traders visualize the most significant trend changes by plotting trend direction lines and dynamically tracking the highest or lowest point within each trend leg. It’s ideal for identifying key price impulses and measuring their magnitude in real time.
🔵 CONCEPTS
- Uses an adaptive trend-following logic based on volatility envelopes created from HMA of the price range (high - low).
- Identifies trend direction and flips when price breaks above or below these dynamic envelopes.
- Tracks swing highs and lows within the current trend leg to highlight trend extremes.
- Calculates and displays the percentage gain or drop from trend start to trend peak/valley.
🔵 FEATURES
- Trend Shift Detection: Plots a colored trend line (uptrend or downtrend) that updates based on price action volatility.
- Impulse Mapping: Draws a dashed line between the point of trend change (close) and the current trend leg's extreme (highest high or lowest low).
How traders can use it
Use Max Trend Points as a chart context layer inside TradingView: read the structure it highlights, compare it with your market bias, and let the script narrow which moves deserve attention.
The strongest workflow is to combine the script with higher timeframe structure, volume context, and a repeatable execution plan instead of treating any single label as a standalone trade.


