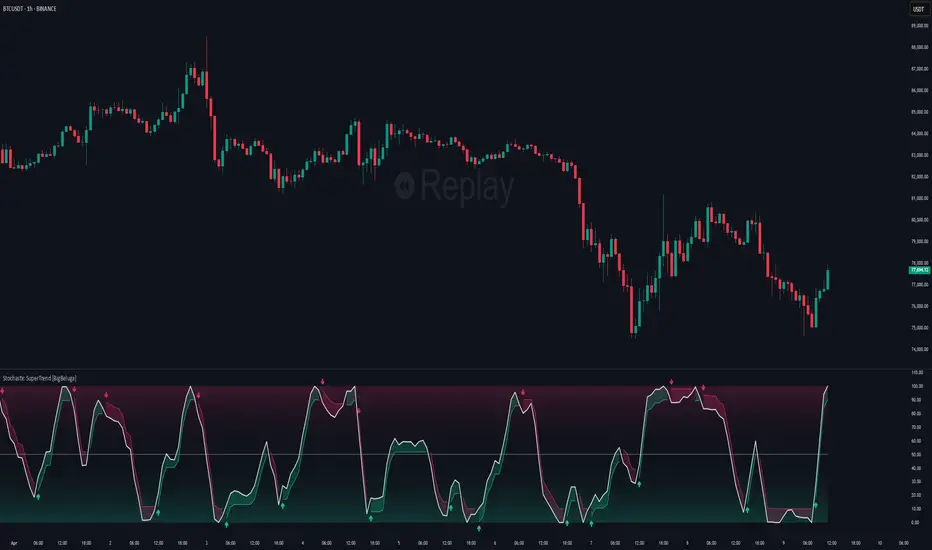
What this TradingView script does
The Mean Reversion Probability Zones indicator measures the likelihood of price reverting back toward its mean. By analyzing oscillator dynamics (RSI, MFI, or Stochastic), it calculates probability zones both above and below the oscillator. These zones are visualized as histograms, colored regions on the main chart, and a compact dashboard, helping traders spot when the market is statistically stretched and more likely to revert.
🔵 CONCEPTS
- Mean Reversion: The tendency of price to return to its average after significant extensions.
- Oscillator-Based Analysis: Uses RSI, MFI, or Stochastic as the base signal for detecting overextension.
- Probability Model: The probability of reversion is computed using three factors:
- Whether the oscillator is rising or declining.
- Whether the oscillator is above or below user-defined thresholds.
- The oscillator’s actual value (distance from equilibrium).
- Dual-Zone Output:
- Upper histogram = probability of downward mean reversion.
How traders can use it
Use Mean Reversion Probability Zones as a chart context layer inside TradingView: read the structure it highlights, compare it with your market bias, and let the script narrow which moves deserve attention.
The strongest workflow is to combine the script with higher timeframe structure, volume context, and a repeatable execution plan instead of treating any single label as a standalone trade.