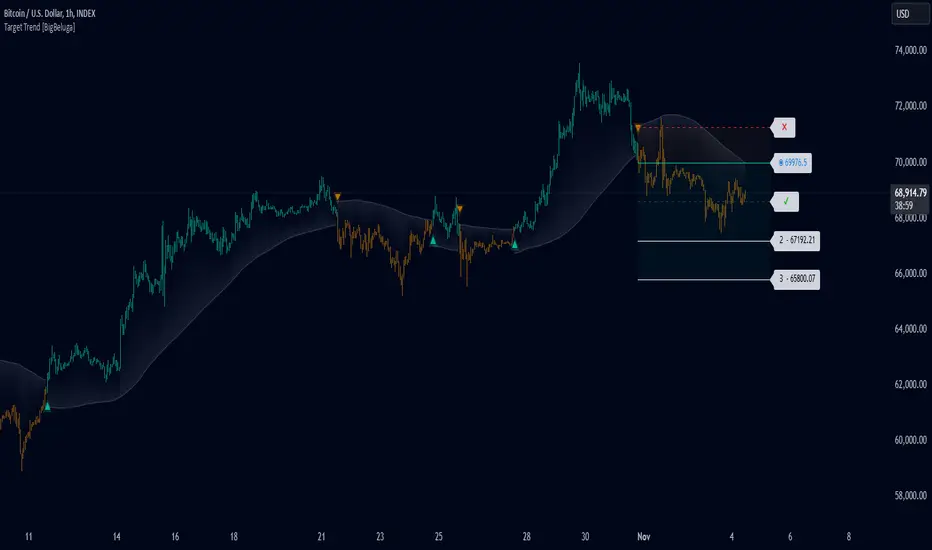
What this TradingView script does
This indicator identifies momentum shifts using a smoothed momentum calculation. It plots dynamic shift zones consisting of five levels that expand or contract based on price action. When momentum rises, the indicator creates an upward shift zone, and when momentum falls, it generates a downward shift zone. The shift zones dynamically react to price, stopping extension when a level is crossed.
🔵Key Features:
- Smoothed Momentum Calculation: ➣ Utilizes a Hull Moving Average (HMA) to smooth momentum and reduce noise. ➣ Identifies momentum shifts with crossovers between the current momentum value and its previous state. ➣ Uses a gradient color scheme to highlight momentum strength.
- Dynamic Shift Zones: ➣ When momentum rises, the indicator plots an upper shift zone with five incremental levels.
➣ When momentum falls, a lower shift zone is formed with five descending levels.
➣ Each level within the shift zone represents a progressively stronger momentum shift.
- Level Extension Control: ➣ Shift zones stop extending once a level is crossed by price. ➣ Levels closer to price act as key momentum resistance or support zones. ➣ If price retraces after a shift, the remaining levels stay intact for further reference.
- Momentum Direction Indications: ➣ Labels (▲ and ▼) appear at momentum shift points to indicate rising or falling momentum.
🔵Usage:
- Momentum-Based Entries: Identify momentum shifts early by using shift zones as confirmation for trade entries.
How traders can use it
Use Momentum Shift as a chart context layer inside TradingView: read the structure it highlights, compare it with your market bias, and let the script narrow which moves deserve attention.
The strongest workflow is to combine the script with higher timeframe structure, volume context, and a repeatable execution plan instead of treating any single label as a standalone trade.