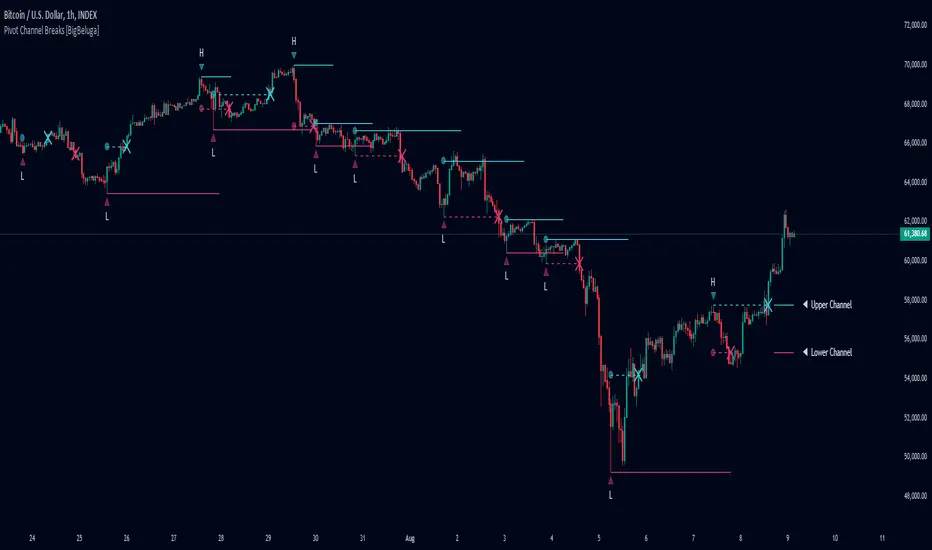
What this TradingView script does
Pivot Trend Flow turns raw swing points into a clean, adaptive trend band. It averages recent pivot highs and lows to form two dynamic reference levels; when price crosses above the averaged highs, trend flips bullish and a green band is drawn; when it crosses below the averaged lows, trend flips bearish and a red band is drawn. During an uptrend the script highlights breakouts of previous pivot highs with ▲ labels, and during a downtrend it flags breakdowns of previous pivot lows with ▼ labels—making structure shifts and continuation signals obvious.
🔵 CONCEPTS
- Pivot-Based Averages: Recent pivot highs/lows are collected and averaged to create smoothed upper/lower reference levels.
if not na(ph) phArray.push(ph) if not na(pl) plArray.push(pl)
if phArray.size() > avgWindow upper := phArray.avg() phArray.shift() if plArray.size() > avgWindow lower := plArray.avg() plArray.shift()
- Trend State via Crosses: Close above the averaged-highs ⇒ bullish trend; close below the averaged-lows ⇒ bearish trend.
- Trend Band: A colored band (green/red) is plotted and optionally filled to visualize the active regime around price.
- Structure Triggers: In bull mode the tool watches for prior pivot-high breakouts (▲).
In bear mode it watches for prior pivot-low breakdowns (▼).
🔵 FEATURES
How traders can use it
Use Pivot Trend Flow as a chart context layer inside TradingView: read the structure it highlights, compare it with your market bias, and let the script narrow which moves deserve attention.
The strongest workflow is to combine the script with higher timeframe structure, volume context, and a repeatable execution plan instead of treating any single label as a standalone trade.