

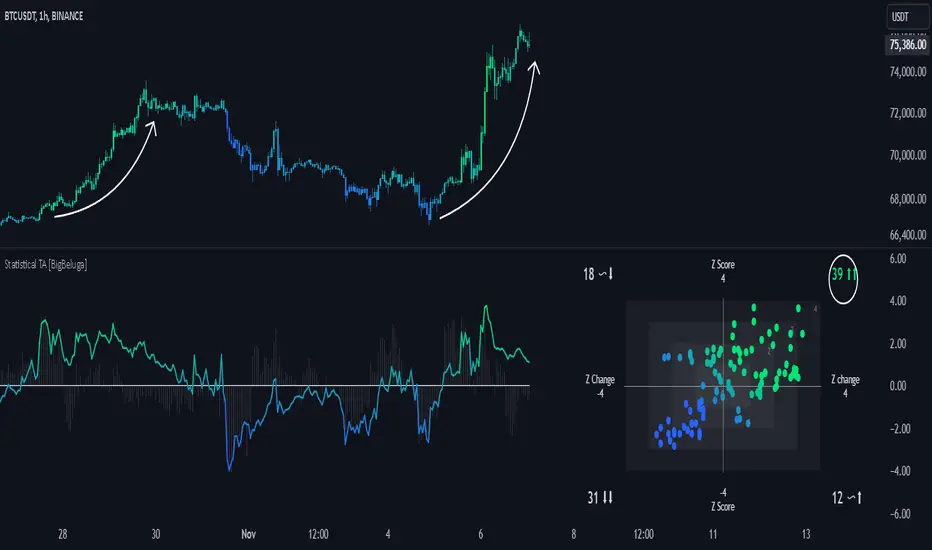
What this TradingView script does
Statistical Trend Analysis (Scatterplot) provides a unique perspective on market dynamics by combining the statistical concept of z-scores with scatterplot visualization to assess price momentum and potential trend shifts.
🧿What is Z-Score?
- Definition: A z-score is a statistical measure that quantifies how far a data point is from the mean, expressed in terms of standard deviations.
- In this Indicator:
- A high positive z-score indicates the price is significantly above the average.
- A low negative z-score indicates the price is significantly below the average.
- The indicator also calculates the rate of change of the z-score, helping identify momentum shifts in the market.
🧿Key Features:
Scatterplot Visualization: Displays data points of z-score and its change across four quadrants.
Quadrants help interpret market conditions:
- Upper Right (Strong Bullish Momentum): Most data points here signal an ongoing uptrend.
How traders can use it
Use Statistical Trend Analysis (Scatterplot) as a chart context layer inside TradingView: read the structure it highlights, compare it with your market bias, and let the script narrow which moves deserve attention.
The strongest workflow is to combine the script with higher timeframe structure, volume context, and a repeatable execution plan instead of treating any single label as a standalone trade.


