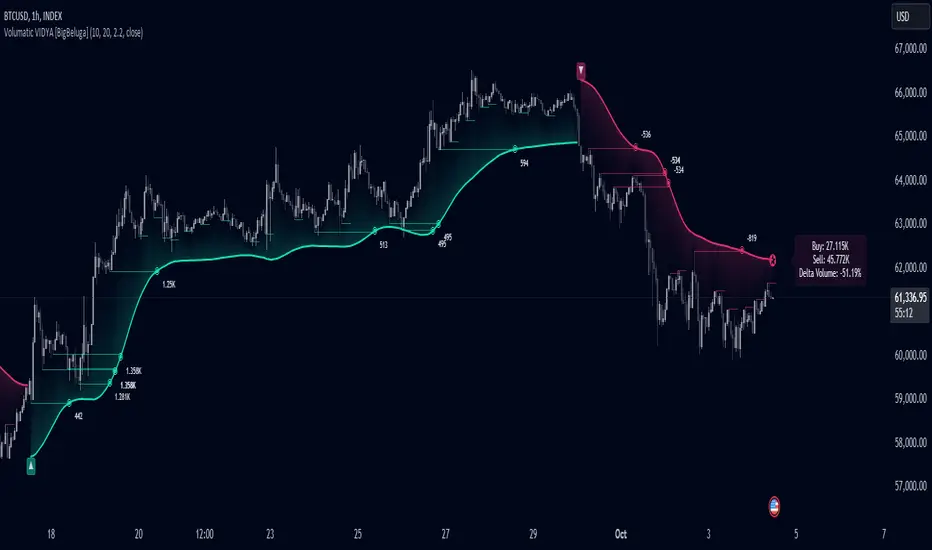
What this TradingView script does
The Swing Traces indicator identifies significant swing points in the market and extends them forward as fading traces. These traces represent the memory of recent highs and lows, showing how price interacts with past turning points over time. Traders can use the fading intensity and breakout signals to gauge when a swing has lost influence or when price reacts to it again.
🔵 CONCEPTS
- Swing Detection – Detects recent upper and lower swing points using sensitivity-based highs and lows.
- Trace Longevity – Each swing projects a “trace” forward in time, gradually fading with age until it expires.
- Trace Size – Each trace is drawn with both a main level and a size extension (half of the bar range) to highlight swing influence.
- Longevity Counters – Swings remain active for a customizable number of bars before fading out or being crossed by price.
- Swing Retest – Labels appear when price retest above/below an active trace extension levels, confirming potential reversal.
🔵 FEATURES
- Adjustable sensitivity length for swing detection.
- Separate longevity controls for upper and lower swing traces.
How traders can use it
Use Swing Traces as a chart context layer inside TradingView: read the structure it highlights, compare it with your market bias, and let the script narrow which moves deserve attention.
The strongest workflow is to combine the script with higher timeframe structure, volume context, and a repeatable execution plan instead of treating any single label as a standalone trade.