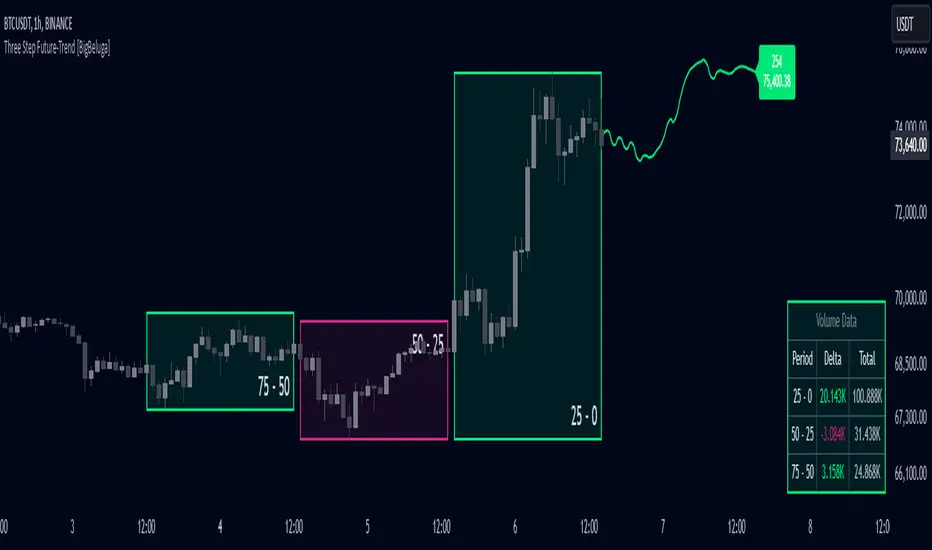
What this TradingView script does
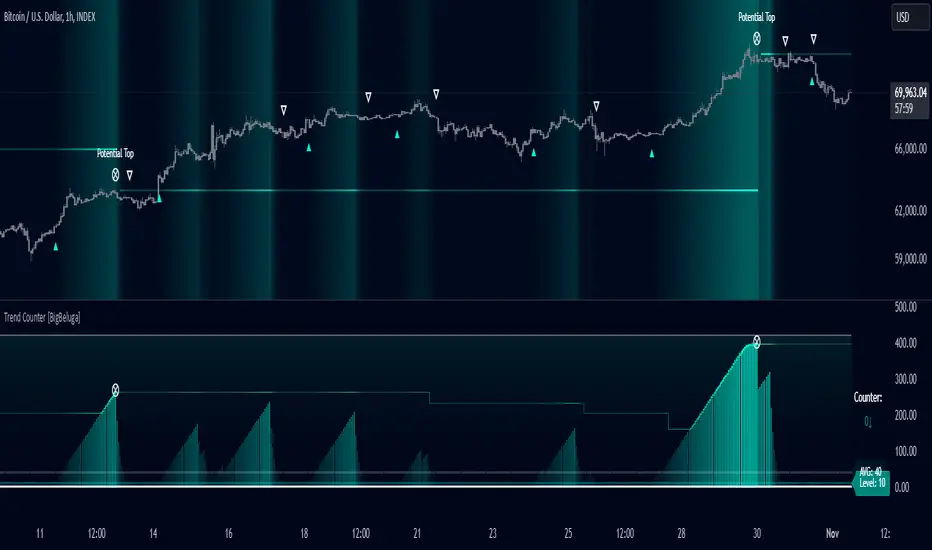
The Trend Counter indicator is designed to help traders identify trend conditions and potential reversals by counting the number of bars within a specified period that are above or below an average price level. By smoothing and averaging these counts, the indicator provides a clear visual representation of market trends and highlights key trend changes.
Key Features:
⦾ Trend Counting: Counts bars above and below average price levels over a specified period. Smooths and rounds the count for better visualization.
// Count bars over length period above highest and lowest avg with offset loop float mid = math.avg(ta.highest(length), ta.lowest(length))
for offset = 0 to length -1 switch hl2 > mid => counter += 1.0 => counter := 0.0 // Smooth Count and Round counter := math.round(ta.ema(counter > 400 ? 400 : counter, smooth))
// Count Avg count.push(counter) avg = math.round(count.avg())
⦿ Color Indication: Uses gradient colors to indicate the strength of the trend. Colors the background based on trend strength for easier interpretation.
⦿ Trend Signals: Provides visual cues for trend changes based on the counter crossing predefined levels.
⦿ Potential Tops: Identifies potential market tops using a specified length and highlights these levels.
⦿ Additional Features: Displays Trend Counter value with arrows to indicate the direction of the trend movement. Displays average trend count and level for reference.
How traders can use it
Use Trend Counter as a chart context layer inside TradingView: read the structure it highlights, compare it with your market bias, and let the script narrow which moves deserve attention.
The strongest workflow is to combine the script with higher timeframe structure, volume context, and a repeatable execution plan instead of treating any single label as a standalone trade.