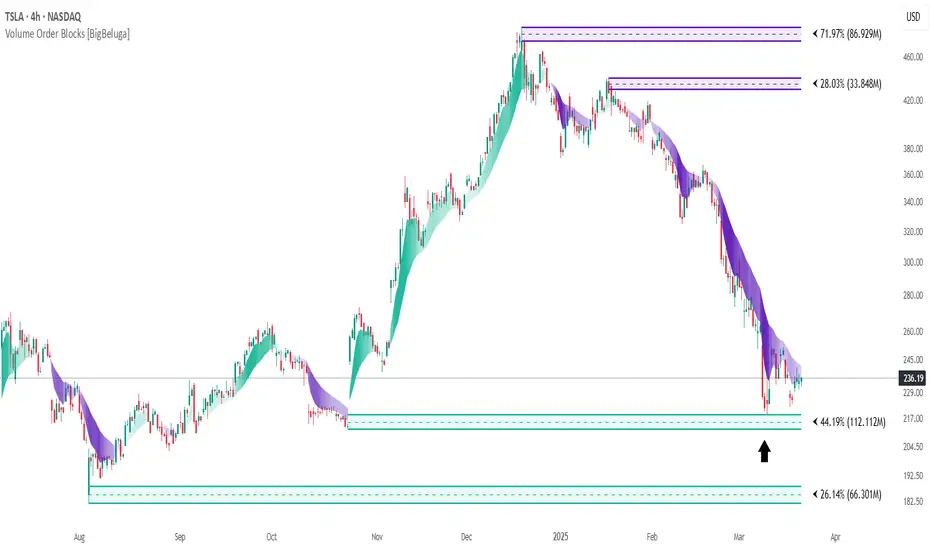
What this TradingView script does
THE VOLUMATIC S/R LEVELS
The Volumatic S/R Levels is an advanced technical analysis tool designed to identify and visualize significant support and resistance levels based on volume and price action.
The core concept of this indicator is to highlight areas where large volume and significant price movements coincide. It does this by plotting horizontal lines at price levels where unusually large candles (in terms of price range) occur alongside high trading volume. These lines represent potential support and resistance levels that are likely to be more significant due to the increased market activity they represent.
⬤ Key Features
- Dynamic S/R Level Identification: Automatically detects and displays support and resistance levels from high volume candles.
- Volume-Weighted Visualization: Uses line color to see positive or negative volume and box size to represent the strength of each level
Positive and Negative Volume:
Box Size Based on Volume:
- Adaptive Levels Color: Adjusts level color based on price above or below level
- Real-time Level Extension: Extends identified levels to the right side of the chart for better visibility
How traders can use it
Use Volumatic S/R Levels as a chart context layer inside TradingView: read the structure it highlights, compare it with your market bias, and let the script narrow which moves deserve attention.
The strongest workflow is to combine the script with higher timeframe structure, volume context, and a repeatable execution plan instead of treating any single label as a standalone trade.