

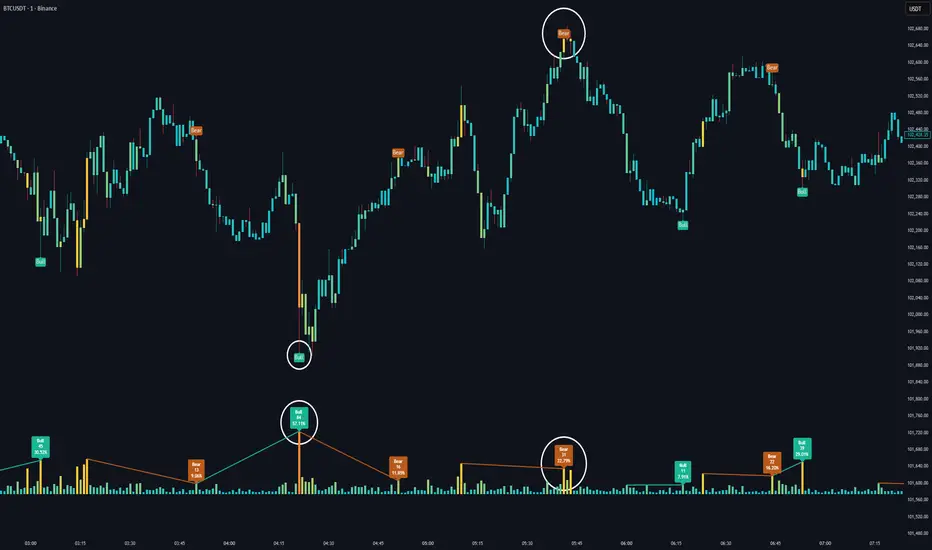
What this TradingView script does
The Volume HeatMap Divergence is a smart volume visualization tool that overlays normalized volume data directly on the chart. Using a color heatmap from aqua to red, it transforms raw volume into an intuitive scale — highlighting areas of weak to intense market participation. Additionally, it detects volume-based divergences from price to signal potential reversals or exhaustion zones. Combined with clear visual labeling, this tool empowers traders with actionable volume insights.
🔵 CONCEPTS
- Normalized Volume Heatmap: Volume is normalized to a 0–100% scale and visually represented as candles below the chart.
float vol = volume / ta.percentile_nearest_rank(volume, 1000, 100) * 100
- Bar Coloring: Price candles are dynamically colored based on volume intensity.
Volume Divergence Logic:
- Bullish Divergence: Price forms a lower low, but volume forms a higher low.
- Bearish Divergence: Price forms a higher high, but volume forms a lower high.
- Dynamic Detection Range: Customizable range ensures divergence signals are meaningful and not random.
- Volume Labels: Additional info on divergence bars shows both the actual volume and its normalized % score.
How traders can use it
Use Volume HeatMap Divergence as a chart context layer inside TradingView: read the structure it highlights, compare it with your market bias, and let the script narrow which moves deserve attention.
The strongest workflow is to combine the script with higher timeframe structure, volume context, and a repeatable execution plan instead of treating any single label as a standalone trade.


