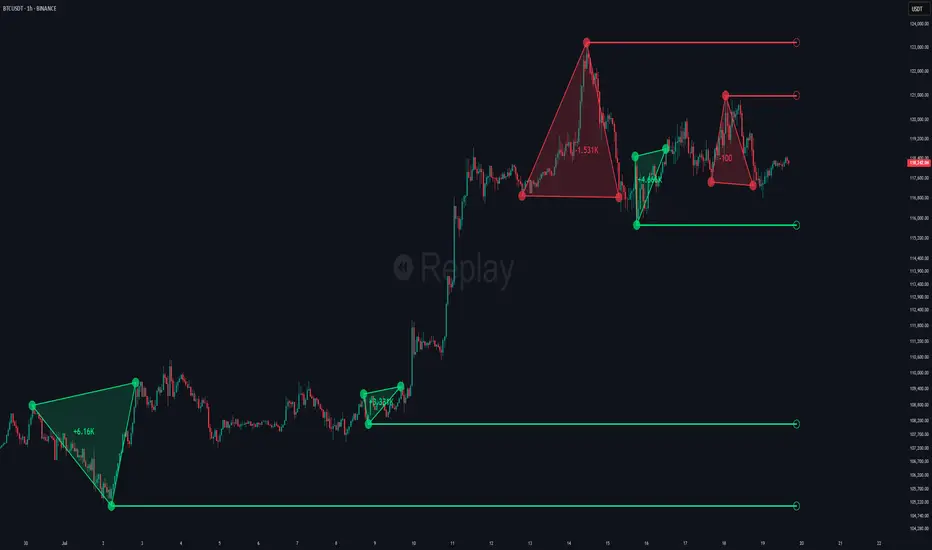
What this TradingView script does
A precision weekly range tracker that captures early market positioning from the first moments of the trading week. By dynamically measuring the highest and lowest points from the first three candles after the Sunday 21:00 UTC open, the indicator builds a reactive support and resistance framework for the week ahead. It also visualizes the active range with a dynamic box and provides live updates of the current price movement against the established range boundaries.
🔵 KEY FEATURES
- Automatically marks the weekly open range starting at Sunday 21:00 UTC.
- Identify maximum high and minimum low from the first 3 candles after the weekly open.
if isWeeklyOpen or isWeeklyOpen or isWeeklyOpen or isWeeklyOpen
h = math.max(high, range_box.get_top()) l = math.min(low, range_box.get_bottom())
- Draws two horizontal lines from the range extremes, acting as dynamic support/resistance zones throughout the week.
- Visualizes the range with a semi-transparent box for clear zone identification.
- Includes a compact dashboard panel with:
- Symbol and current price with bullish or bearish bar indication with ▲ / ▼
- Current weekly high/low range values
How traders can use it
Use Weekly Open Range as a chart context layer inside TradingView: read the structure it highlights, compare it with your market bias, and let the script narrow which moves deserve attention.
The strongest workflow is to combine the script with higher timeframe structure, volume context, and a repeatable execution plan instead of treating any single label as a standalone trade.