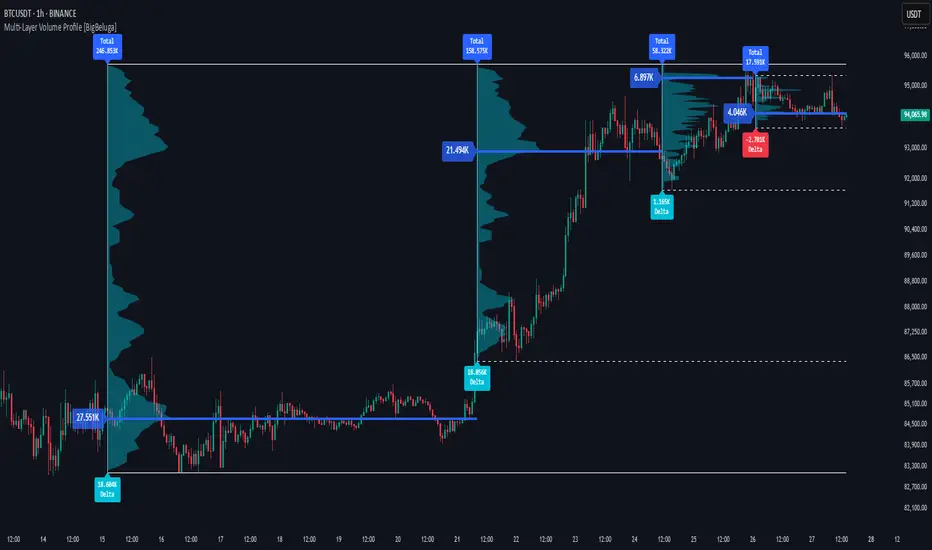
What this TradingView script does
The DeltaFlow Volume Profile builds a compact volume profile next to price and enriches every bin with flow context: bullish vs. bearish participation (%), a per-bin Delta %, an optional Delta Heat Map, and a PoC band with the bin’s absolute volume. This lets you see not just where volume clustered, but who (buyers or sellers) dominated inside each price slice.
🔵 CONCEPTS
- Binned Volume Profile: Price range over a user-defined LookBack is split into Bins; each bin aggregates traded volume.
- Bull/Bear Split: Within every bin, volume is separated by candle direction into Bull Volume and Bear Volume, then normalized to % of the bin’s displayed size.
- Delta %: The difference between Bull % and Bear % for the bin. Positive = buyer dominance; negative = seller dominance.
- Delta Heat Map: Bin background shading that scales with both total volume strength and delta bias.
- PoC (Point of Control): The most significant bin gets a PoC band and a label with its absolute volume.
🔵 FEATURES
- Profile with Flow: A clean horizontal volume bar per bin plus stacked Bull % and Bear %.
- Per-Bin Delta Label: A readable “Δ xx%” tag at the start of each bin shows dominance at a glance.
How traders can use it
Use DeltaFlow Volume Profile as a chart context layer inside TradingView: read the structure it highlights, compare it with your market bias, and let the script narrow which moves deserve attention.
The strongest workflow is to combine the script with higher timeframe structure, volume context, and a repeatable execution plan instead of treating any single label as a standalone trade.