What this TradingView script does
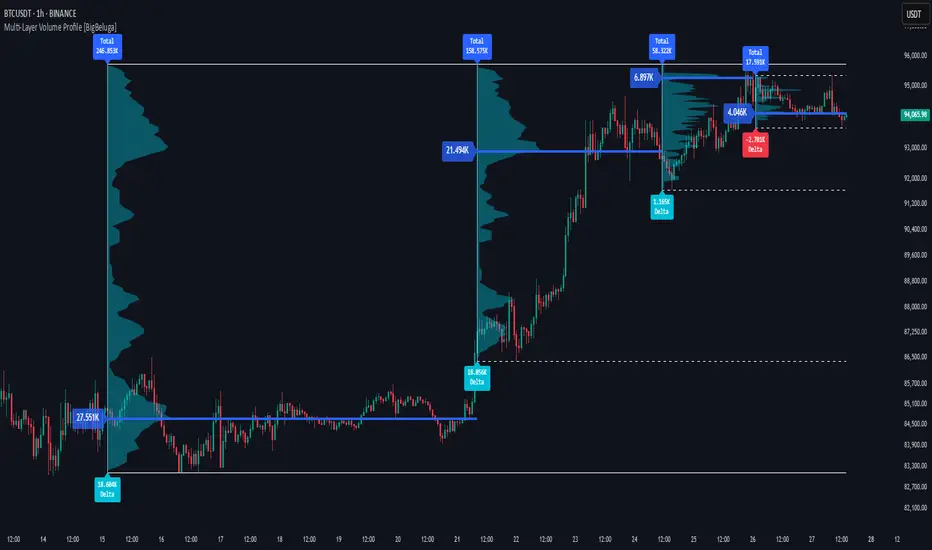
A powerful multi-resolution volume analysis tool that stacks multiple profiles of historical trading activity to reveal true market structure. This indicator breaks down total and delta volume distribution across time at four adjustable depths — enabling traders to spot major POCs, volume shelves, and zones of price acceptance or rejection with unmatched clarity.
🔵 KEY FEATURES
- Multi-Layer Volume Profiles:
- Profile 1: Full period
- Profile 2: Half-length
- Profile 3: Quarter-length
- Profile 4: One-eighth-length
This layering helps traders assess confluence across different time horizons.
- Custom Bin Resolution: Each profile uses a customizable number of bins to control visual precision. More bins = higher granularity, fewer bins = smoother profile.
- Precise POC Highlighting: The price level with the maximum traded volume in each profile is highlighted with a thick blue POC line. This key level shows the most accepted price for each period.
- Total and Delta Volume Labels:
- Total Volume: Displays cumulative volume over the profile period at the top of the profile box.
- Delta Volume: The difference between bullish and bearish volume is labeled at the base, showing directional pressure.
- Range Levels: Each profile includes horizontal reference lines showing its high, low, bounds. These edges often align with price reaction zones and become future resistance/support.
🔵 HOW IT WORKS
- For each active profile, the indicator:
- Collects price range (highs/lows) across the selected `length`
- Divides this range into equal bins
- Assigns volume into bins based on candle close location
- Aggregates volume per bin to form the profile (polylines)
How traders can use it
Use Multi-Layer Volume Profile as a chart context layer inside TradingView: read the structure it highlights, compare it with your market bias, and let the script narrow which moves deserve attention.
The strongest workflow is to combine the script with higher timeframe structure, volume context, and a repeatable execution plan instead of treating any single label as a standalone trade.