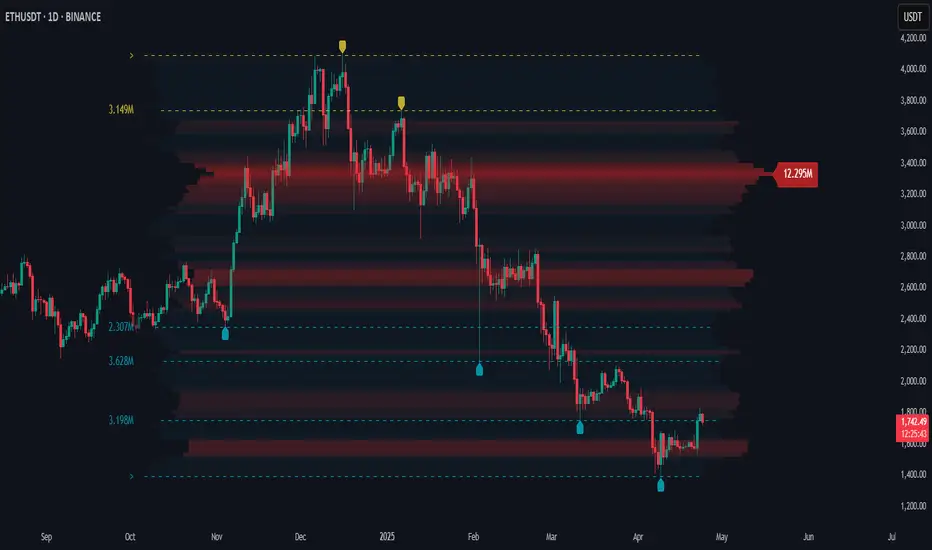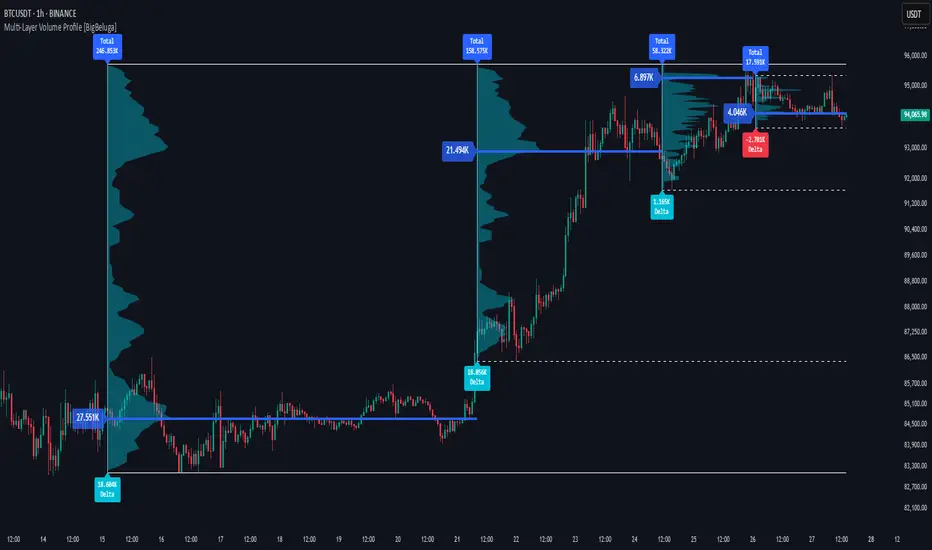
What this TradingView script does
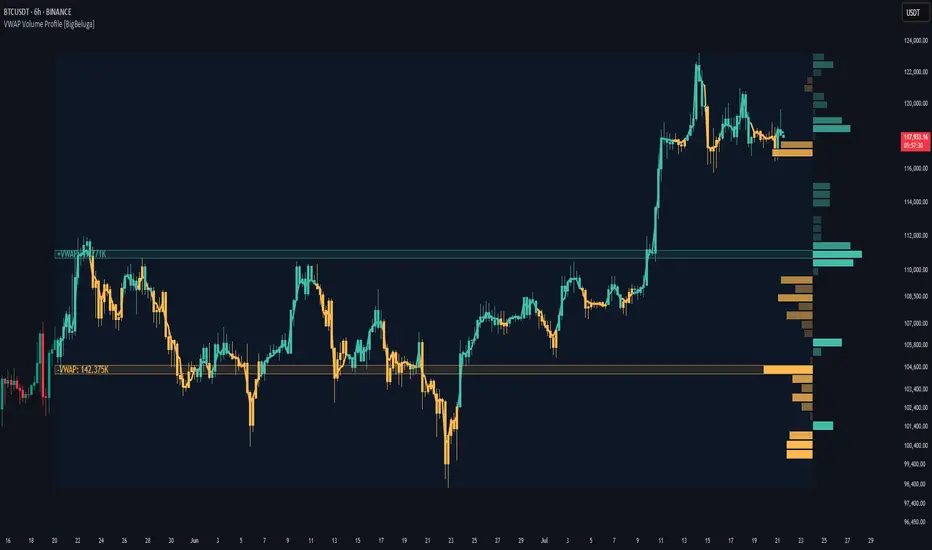
VWAP Volume Profile is an advanced hybrid of the VWAP and volume profile concepts. It visualizes how volume accumulates relative to VWAP movement—separating rising (+VWAP) and declining (−VWAP) activity into two mirrored horizontal profiles. It highlights the dominant price bins (POCs) where volume peaked during each directional phase, helping traders spot hidden accumulation or distribution zones.
🔵 CONCEPTS
- VWAP-Driven Profiling: Unlike standard volume profiles, this tool segments volume based on VWAP movement—accumulating positive or negative volume depending on VWAP slope.
- Dual-Sided Profiles: Profiles expand horizontally to the right of price. Separate bins show rising (+) and falling (−) VWAP volume.
- Bin Logic: Volume is accumulated into defined horizontal bins based on VWAP’s position relative to price ranges.
- Gradient Coloring: Volume bars are colored with a dynamic gradient to emphasize intensity and direction.
- POC Highlighting: The highest-volume bin in each profile type (+/-) is marked with a transparent box and label.
- Contextual VWAP Line: VWAP is plotted and dynamically colored (green = rising, orange = falling) for instant trend context.
- Candle Overlay: Price candles are recolored to match the VWAP slope for full visual integration.
🔵 FEATURES
How traders can use it
Use VWAP Volume Profile as a chart context layer inside TradingView: read the structure it highlights, compare it with your market bias, and let the script narrow which moves deserve attention.
The strongest workflow is to combine the script with higher timeframe structure, volume context, and a repeatable execution plan instead of treating any single label as a standalone trade.