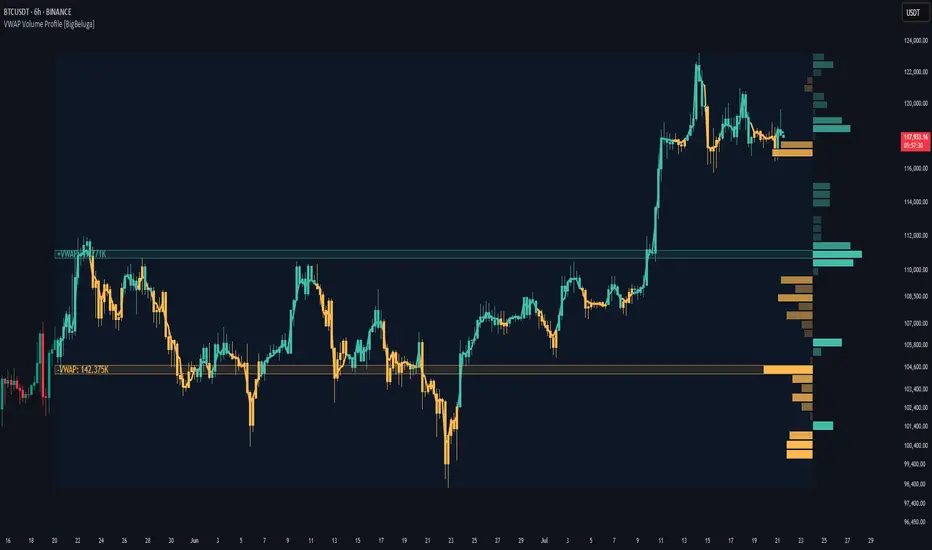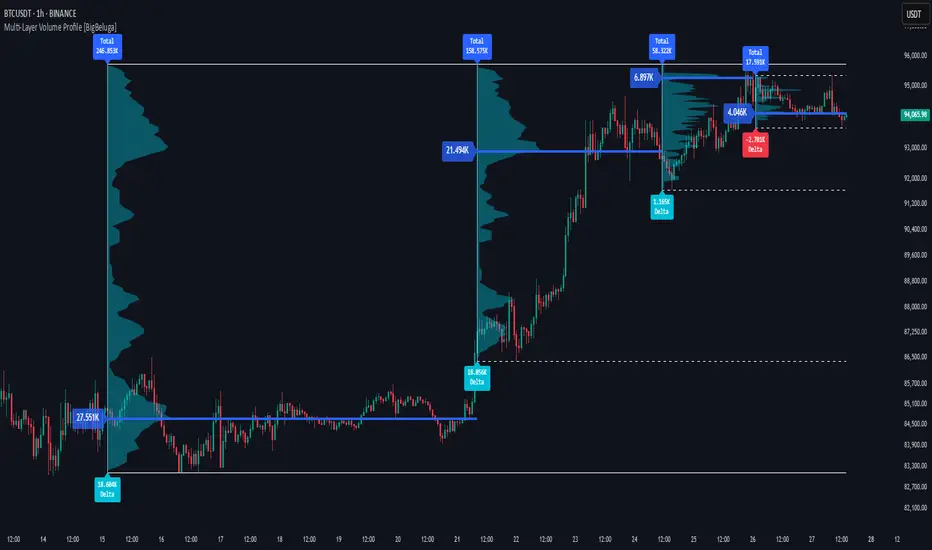
What this TradingView script does
An advanced volume-based tool designed to map out how trading activity is distributed across price levels. It combines dynamic volume profiling with structural pivot detection to highlight key levels of interest in the market — including hidden support/resistance zones and dominant liquidity areas.
Unlike traditional volume profiles locked to fixed sessions, this indicator continuously processes historical bars to build a real-time "map" of volume distribution. It intelligently reveals where buyers and sellers were most active, helping traders pinpoint high-impact zones with clarity.
🔵 KEY FEATURES
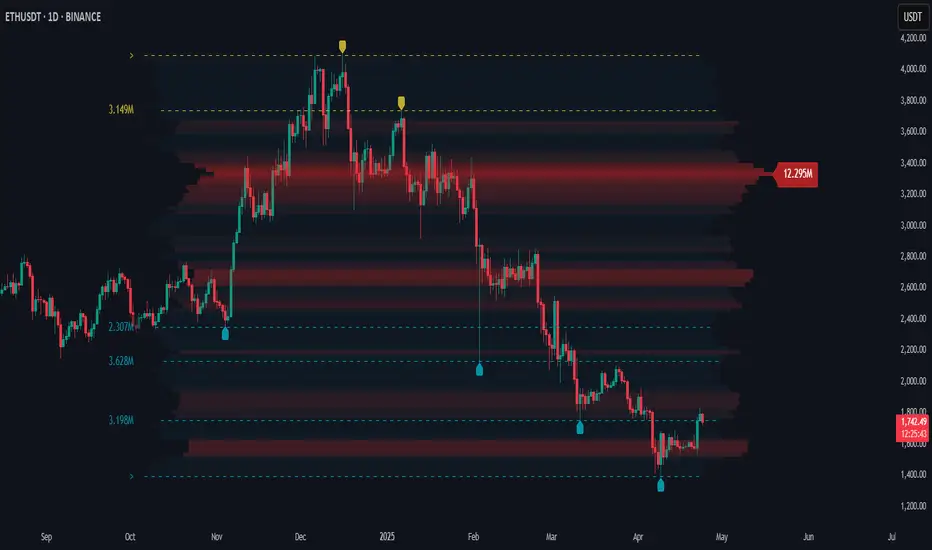
- Creates a volume map profile by scanning price action over a defined lookback window (`length`).
- Divides price vertically into volume bins (default: 100) and aggregates either total volume or bar count per bin.
- Bins are plotted as horizontal zones extending to the right of the chart — wider offset means more volume at that price.
- Each zone is color-coded using gradients to represent volume magnitude:
- Below average volume = cool tones (blue/teal)
- Above average volume = warm tones (red/orange)
- The highest volume bin is highlighted with a red label showing the exact volume, helping to identify strong price agreement.
- Detects pivot highs and lows using a 15-bar swing method, marking them as potential S/R levels.
- If a pivot level is located inside a low-volume zone (volume < average), it is emphasized with a dashed line and label.
How traders can use it
Use Price Map Profile as a chart context layer inside TradingView: read the structure it highlights, compare it with your market bias, and let the script narrow which moves deserve attention.
The strongest workflow is to combine the script with higher timeframe structure, volume context, and a repeatable execution plan instead of treating any single label as a standalone trade.