What this TradingView script does
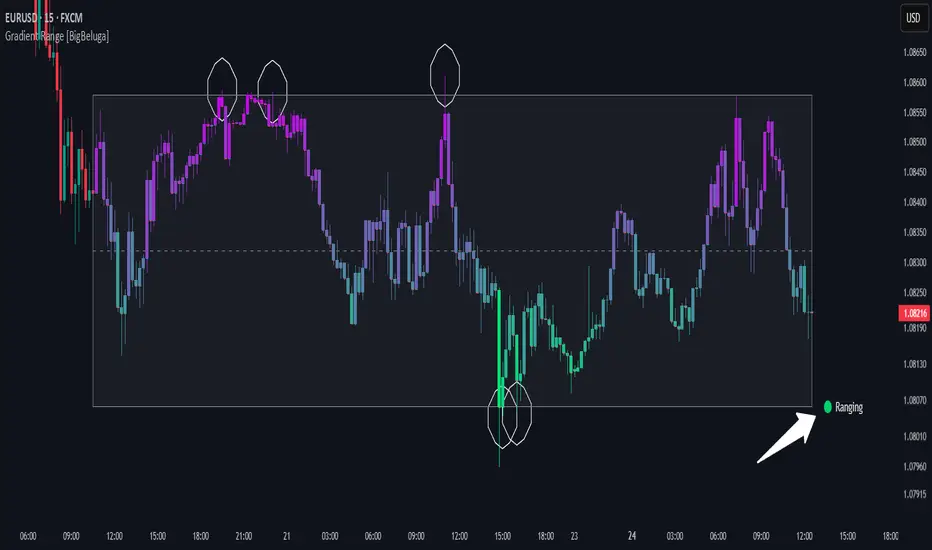
This indicator highlights range-bound market conditions by dynamically plotting gradient-colored candlesticks within a defined price box. It detects whether the market is ranging or trending using ADX and can identify mean reversion points when price steps outside the established range.
🔵KEY FEATURES:
- Range Detection Box: ➣ A transparent box is drawn based on the highest and lowest price close over a user-defined period. ➣ Helps visualize range boundaries and the midline for support/resistance reference.
- Gradient Candlestick Coloring: ➣ Candles inside the range are colored with a gradient from top to bottom based on proximity to the midline. ➣ Top range candles are shaded with bearish tones, while bottom range candles use bullish tones.
- Ranging/Trending State Detection: ➣ Uses ADX to determine if the market is currently in a ranging or trending state. ➣ A label in the bottom right corner shows a real-time status (🟢 Ranging / 🟡 Trending).
- Mean Reversion Signal Circles: ➣ When the market is ranging, white circles are plotted at highs/lows that breach the box boundary, indicating potential mean reversion points. ➣ These levels can act as fade trade setups or exhaustion markers.
🔵USAGE:
- Range Trading: Trade between the upper and lower boundaries during range-bound conditions with clearer visual feedback.
- Mean Reversion Plays: Use circle signals as early alerts to identify when price extends beyond the range and may revert to the mean.
- Visual Trend Strength: Instantly recognize where price is concentrated inside the range via the color gradient system.
How traders can use it
Use Gradient Range as a chart context layer inside TradingView: read the structure it highlights, compare it with your market bias, and let the script narrow which moves deserve attention.
The strongest workflow is to combine the script with higher timeframe structure, volume context, and a repeatable execution plan instead of treating any single label as a standalone trade.