What this TradingView script does
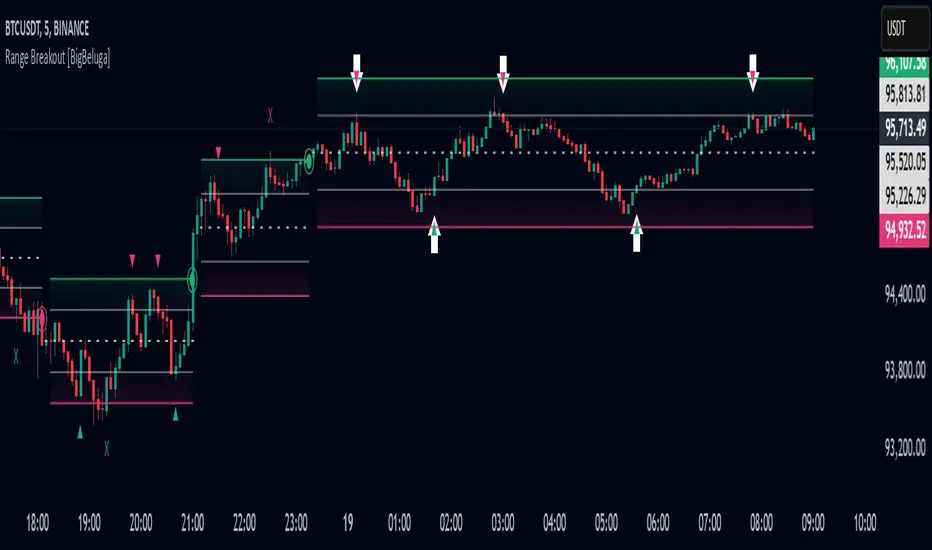
Range Breakout is a dynamic channel-based indicator designed to identify breakout opportunities and price reactions within defined ranges. It automatically creates upper and lower bands with a midline, helping traders spot breakout zones, retests, and potential fakeouts.
🔵Key Features: Dynamic Channel Formation:
- Automatically plots upper and lower channel bands with a midline based on ATR calculations.
- Channels adjust upon breakout events or after a predefined number of bars to reflect new price ranges.
Breakout Detection:
- Green circles appear when price breaks above the upper channel edge.
- Red circles appear when price breaks below the lower channel edge.
- A new channel is formed after each breakout, allowing traders to monitor evolving price ranges.
Retest Signals:
- Upward-pointing green triangles signal a retest of the lower band, indicating potential support.
- Downward-pointing red triangles indicate a retest of the upper band, suggesting possible resistance.
Filter Signals by Trends (New Feature):
- Optional toggle to filter ▲ and ▼ signals based on channel breakout conditions.
- When enabled:
- In a bullish channel (confirmed by a green circle breakout), only ▲ signals are displayed.
- In a bearish channel (confirmed by a red circle breakout), only ▼ signals are displayed.
How traders can use it
Use Range Breakout as a chart context layer inside TradingView: read the structure it highlights, compare it with your market bias, and let the script narrow which moves deserve attention.
The strongest workflow is to combine the script with higher timeframe structure, volume context, and a repeatable execution plan instead of treating any single label as a standalone trade.