What this TradingView script does
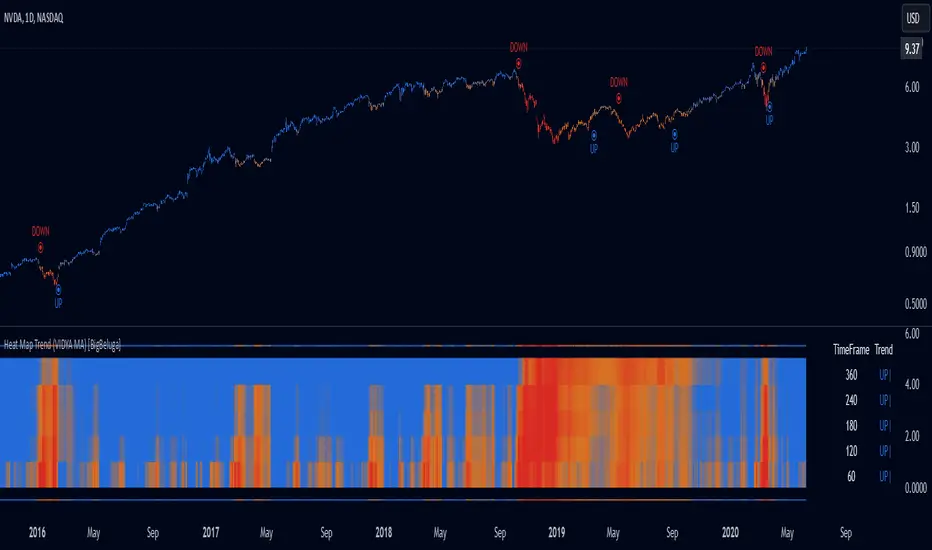
The Heat Map Trend (VIDYA MA) - BigBeluga indicator is a multi-timeframe trend detection tool based on the Volumetric Variable Index Dynamic Average (VIDYA). This indicator calculates trends using volume momentum, or volatility if volume data is unavailable, and displays the trends across five customizable timeframes. It features a heat map to visualize trends, color-coded candles based on an average of the five timeframes, and a dashboard that shows the current trend direction for each timeframe. This tool helps traders identify trends while minimizing market noise and is particularly useful in detecting faster market changes in shorter timeframes.
🔵 KEY FEATURES & USAGE
◉Volumetric Variable Index Dynamic Average (VIDYA):
The core of the indicator is the VIDYA moving average, which adjusts dynamically based on volume momentum. If volume data isn't available, the indicator uses volatility instead to smooth the moving average. This allows traders to assess the trend direction with more accuracy, using either volume or volatility, if volume data is not provided, as the basis for the trend calculation.
// VIDYA CALCULATION ----------------------------------------------------------------------------------------- // ATR (Average True Range) and volume calculation bool volume_check = ta.cum(volume) <= 0 float atrVal = ta.atr(1) float volVal = volume_check ? atrVal : volume // Use ATR if volume is not available
// @function: Calculate the VIDYA (Volumetric Variable Index Dynamic Average) vidya(src, len, cmoLen) => float cmoVal = ta.sma(ta.cmo(volVal, cmoLen), 10) // Calculate the CMO and smooth it with an SMA float absCmo = math.abs(cmoVal) // Absolute value of CMO float alpha = 2 / (len + 1) // Alpha factor for smoothing var float vidyaVal = 0.0 // Initialize VIDYA vidyaVal := alpha * absCmo / 100 * src + (1 - alpha * absCmo / 100) * nz(vidyaVal) // VIDYA formula
◉Multi-Timeframe Trend Analysis with Heat Map Visualization:
The indicator calculates VIDYA across five customizable timeframes, allowing traders to analyze trends from multiple perspectives. The resulting trends are displayed as a heat map below the chart, where each timeframe is represented by a gradient color. The color intensity reflects the distance of the moving average (VIDYA) from the price, helping traders to identify trends on different timeframes visually. Shorter timeframes in the heat map are particularly useful for detecting faster market changes, while longer timeframes help to smooth out market noise and highlight the general trend. Trend Direction:
Heat Map Reading:
◉Dashboard for Multi-Timeframe Trend Directions:
How traders can use it
Use Heat Map Trend (VIDYA MA) as a chart context layer inside TradingView: read the structure it highlights, compare it with your market bias, and let the script narrow which moves deserve attention.
The strongest workflow is to combine the script with higher timeframe structure, volume context, and a repeatable execution plan instead of treating any single label as a standalone trade.