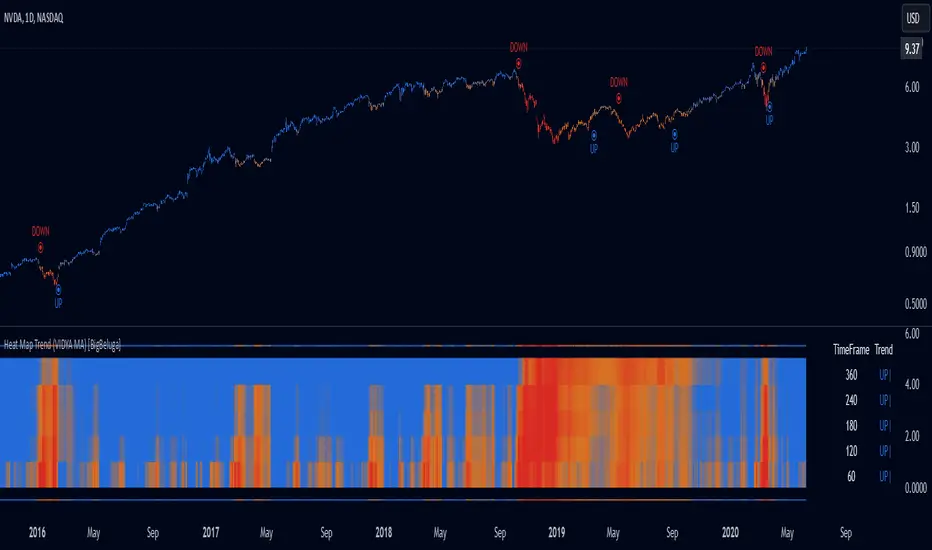
What this TradingView script does
Multi-Timeframe Trend Analysis A powerful trend-following dashboard designed to help traders monitor and compare trend direction across multiple higher timeframes. By analyzing EMA conditions from five customizable timeframes, this tool gives a clear visual breakdown of short- to long-term trend alignment.
🔵Key Features:
- Multi-Timeframe EMA Dashboard: ➣ Displays a table in the top-right corner showing trend direction across 5 user-defined timeframes. ➣ Each row shows whether ema is rising or falling its corresponding EMA for that timeframe. ➣ Green arrows (🢁) indicate uptrends, purple arrows (🢃) signal downtrends.
- Custom Timeframe Selection: ➣ Traders can input any 5 timeframes (e.g., 1h, 2h, 3h, etc.) with individual EMA lengths for flexible trend mapping. ➣ The tool auto-adjusts to match and align external timeframe EMAs to the current chart for seamless overlay.
- Dynamic Chart Arrows: ➣ On-chart arrows mark when EMA rising or falling EMAs from the current chart timeframe. ➣ Each EMA arrows has a unique transparency level—shorter EMA arrows are more transparent, longer EMA arrows are more vivid. (Hover Mouse over the arrow to see which EMAs it is)
- Gradient EMA Plotting: ➣ All five EMAs are plotted with gradually increasing opacity. ➣ Gradient fills between EMAs enhance visual structure, making it easier to track convergence/divergence.
🔵Usage:
- Trend Confirmation: Use the dashboard to confirm multi-timeframe trend alignment before entering trades.
- Entry Filtering: Avoid countertrend trades by spotting when higher timeframes disagree with the current one.
- Momentum Insight: Track the transition of arrows from lighter to stronger opacity to visualize trend shifts over time.
How traders can use it
Use Multi-Timeframe Trend Analysis as a chart context layer inside TradingView: read the structure it highlights, compare it with your market bias, and let the script narrow which moves deserve attention.
The strongest workflow is to combine the script with higher timeframe structure, volume context, and a repeatable execution plan instead of treating any single label as a standalone trade.