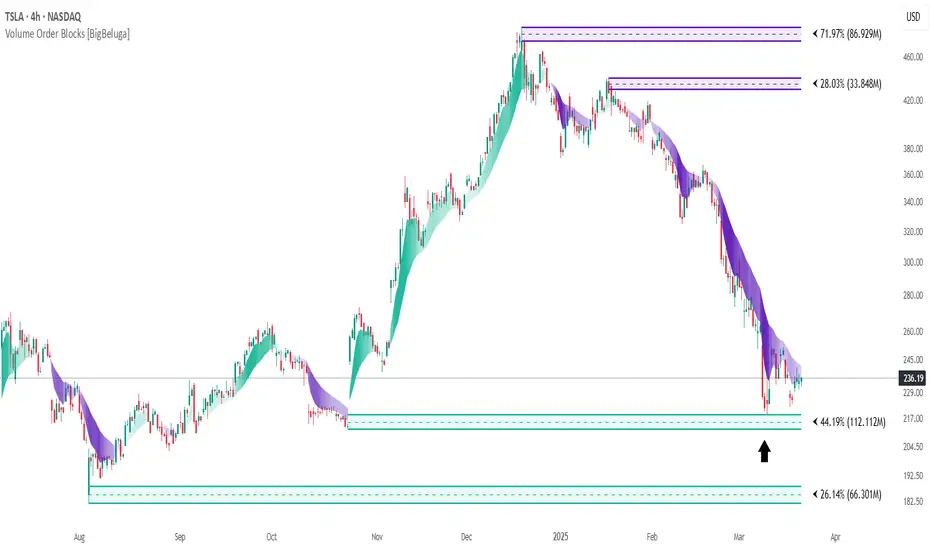
What this TradingView script does
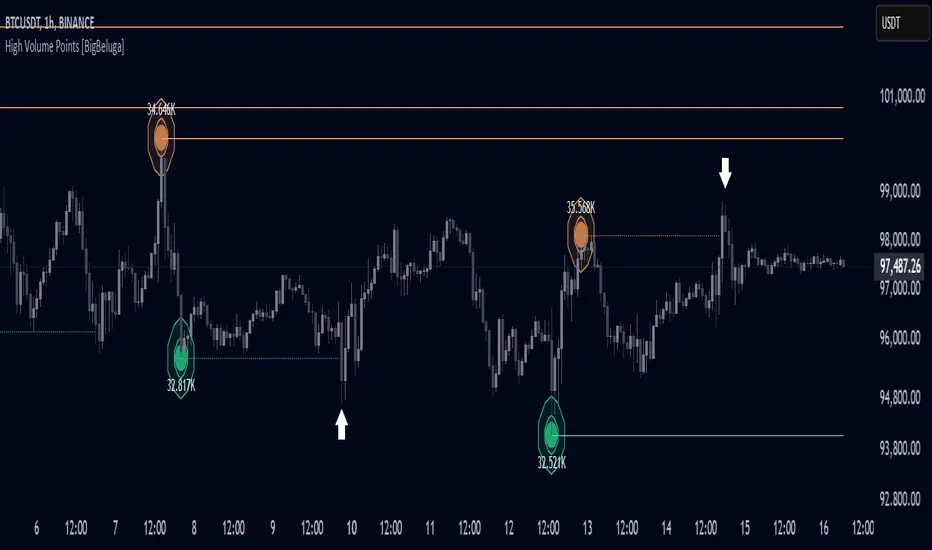
High Volume Points is a unique volume-based indicator designed to highlight key liquidity zones where significant market activity occurs. By visualizing high-volume pivots with dynamically sized markers and optional support/resistance levels, traders can easily identify areas of interest for potential breakouts, liquidity grabs, and trend reversals.
🔵Key Features:
High Volume Points Visualization:
- The indicator detects pivot highs and lows with exceptionally high trading volume.
- Each high-volume point is displayed as a concentric circle, with its size dynamically increasing based on the volume magnitude.
- The exact volume at the pivot is shown within the circle.
Dynamic Levels from Volume Pivots:
- Horizontal levels are drawn from detected high-volume pivots to act as support or resistance.
- Traders can use these levels to anticipate potential liquidity zones and market reactions.
Liquidity Grabs Detection:
- If price crosses a high-volume level and grabs liquidity, the level automatically changes to a dashed line.
- This feature helps traders track areas where institutional activity may have occurred.
Volume-Based Filtering:
- Users can filter volume points by a customizable threshold from 0 to 6, allowing them to focus only on the most significant high-volume pivots.
- Lower thresholds capture more volume points, while higher thresholds highlight only the most extreme liquidity events.
How traders can use it
Use High Volume Points as a chart context layer inside TradingView: read the structure it highlights, compare it with your market bias, and let the script narrow which moves deserve attention.
The strongest workflow is to combine the script with higher timeframe structure, volume context, and a repeatable execution plan instead of treating any single label as a standalone trade.