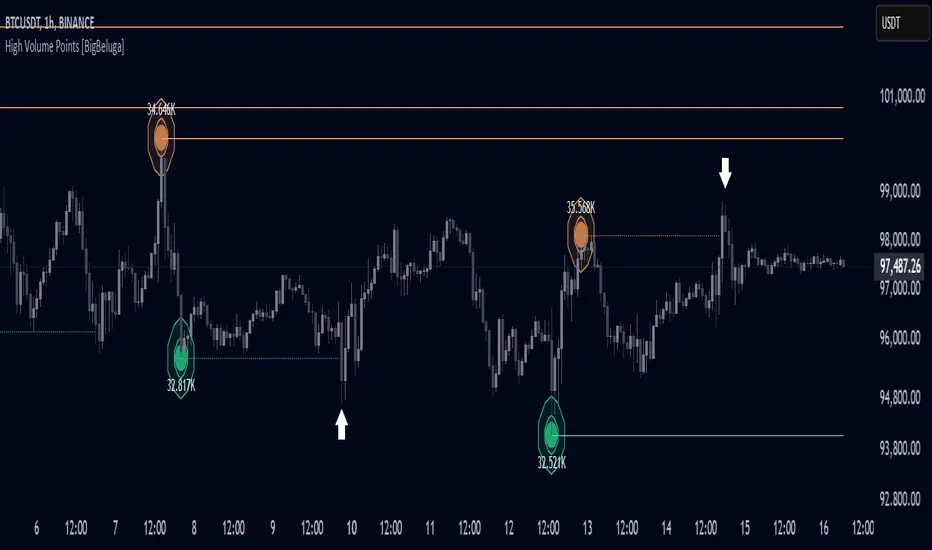
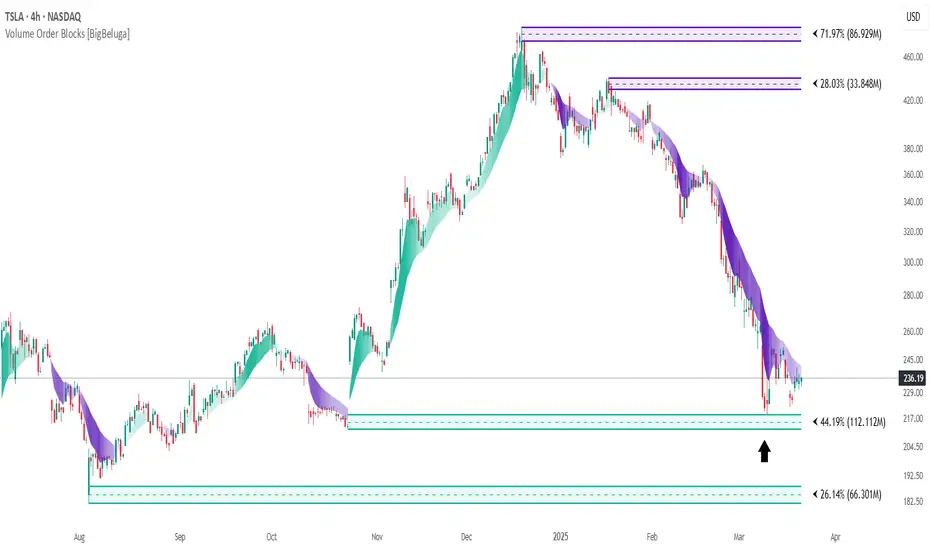
What this TradingView script does
The Wick Pressure Zones indicator highlights areas where extreme wick activity occurred, signaling strong buy or sell pressure. By measuring unusually long upper or lower wicks and mapping them into gradient volume zones, the tool helps traders identify levels where liquidity was absorbed, leaving behind footprints of supply and demand imbalances. These zones often act as support, resistance, or liquidity sweep magnets.
🔵 CONCEPTS
- Extreme Wicks: Large upper or lower shadows indicate aggressive rejection — upper wicks suggest selling pressure, lower wicks suggest buying pressure.
- Volumatic Gradient Zones: From each detected wick, the indicator projects a layered gradient zone, proportional to the wick’s size, showing where most pressure occurred.
- Liquidity Footprints: These zones mark levels where significant buy/sell volume was executed, often becoming reaction points on future retests.
- Automatic Expiration: Zones persist until price decisively trades through them, after which they are cleared to keep the chart clean.
🔵 FEATURES
- Automatic Wick Detection: Identifies extreme upper and lower wick events using percentile filtering and Realative Strength Index.
- Gradient Zone Visualization: Builds a 10-layer zone from the wick top/bottom, shading intensity according to pressure strength.
- Volume Labels: Each zone is annotated with the bar’s volume at the origin point for added context.
How traders can use it
Use Wick Pressure Zones as a chart context layer inside TradingView: read the structure it highlights, compare it with your market bias, and let the script narrow which moves deserve attention.
The strongest workflow is to combine the script with higher timeframe structure, volume context, and a repeatable execution plan instead of treating any single label as a standalone trade.