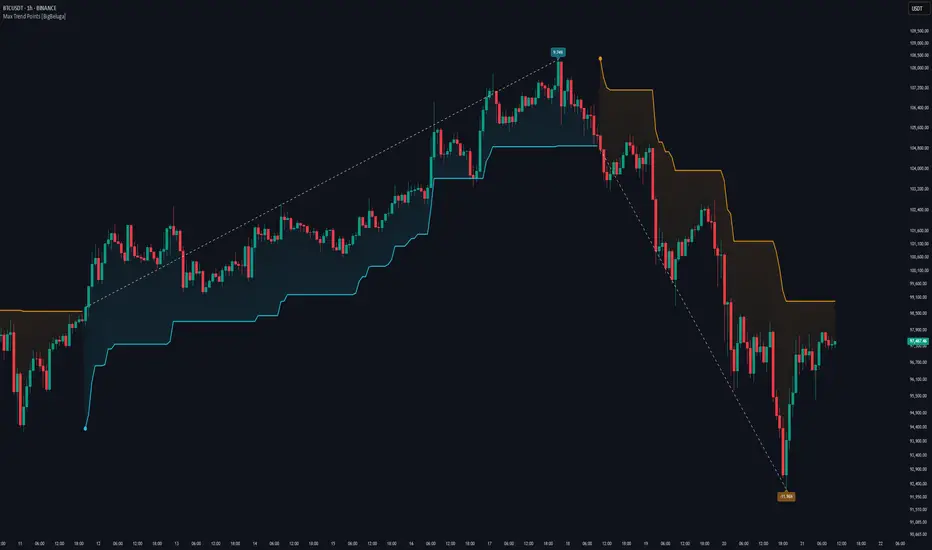
What this TradingView script does
🔵HTF TrendMap A powerful visual overlay that brings higher timeframe market structure directly onto your intraday chart. This tool maps directional bias, trend strength, and dynamic range boundaries from a user-selected HTF (like Daily or 4H), offering a real-time confluence layer for scalpers, day traders, and swing traders. By plotting the evolving average (HL2), it acts as a volatility-weighted trend anchor, allowing you to align lower timeframe entries with higher timeframe intent.
Technical Overview: At the close of each higher timeframe (HTF) candle, the indicator stores the high, low, and calculates the HL2 midpoint. These values are then referenced on the lower timeframe chart to plot trend direction and price boundaries.
🔵 KEY FEATURES
- Maps the selected higher timeframe (HTF) (e.g., Daily) onto your current chart.
- At the close of each HTF candle, it starts to calculate and store the highest, lowest, and average (HL2) price levels.
- The average (HL2) value is treated as the HTF trend baseline—plotted in orange for uptrend, blue for downtrend.
- Visual curve thickens and fades to show progress through the HTF period (stronger color = fresher data).
- Horizontal dashed lines show HTF high and low levels that persist until the next period closes.
- On every HTF close, two price labels are printed for the high and low levels.
- Vertical separators visually mark the start of each HTF candle for easy structural recognition.
How traders can use it
Use Higher Timeframe TrendMap as a chart context layer inside TradingView: read the structure it highlights, compare it with your market bias, and let the script narrow which moves deserve attention.
The strongest workflow is to combine the script with higher timeframe structure, volume context, and a repeatable execution plan instead of treating any single label as a standalone trade.