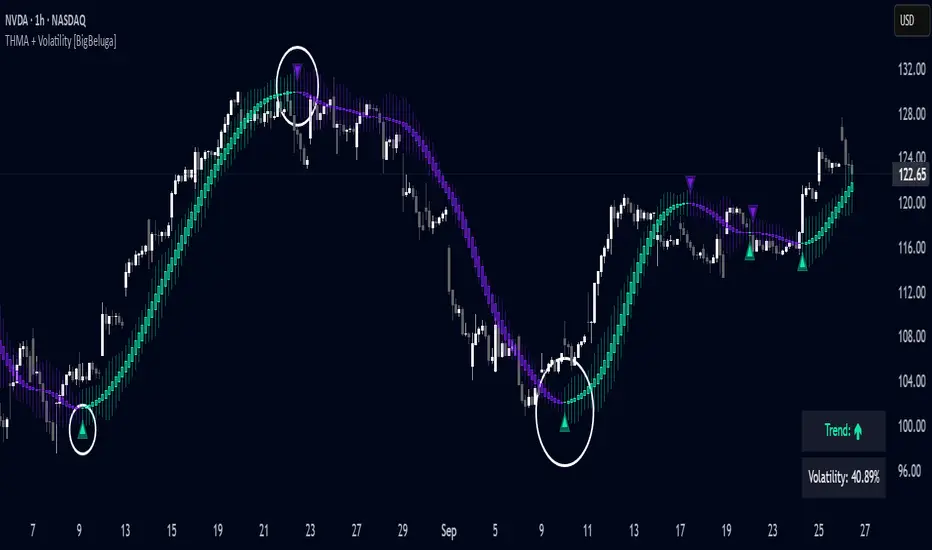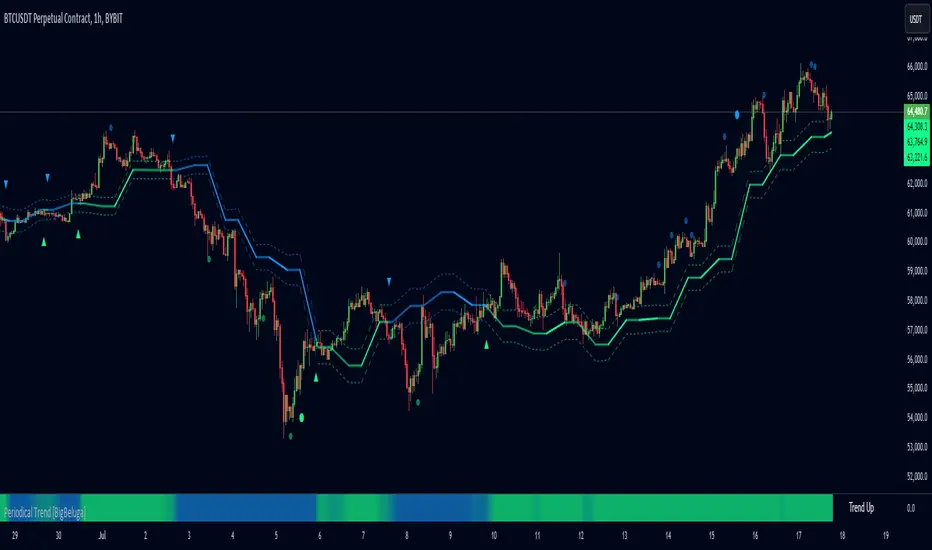
What this TradingView script does
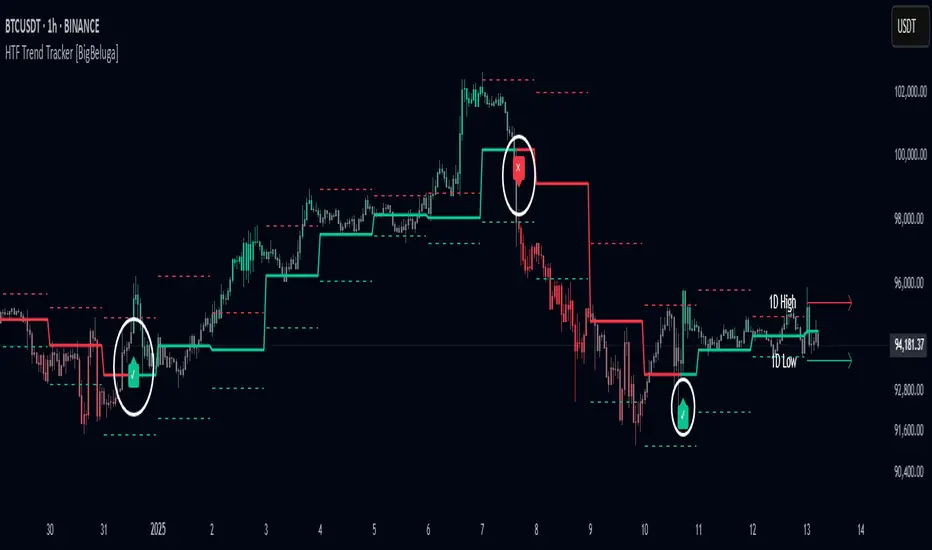
HTF Trend Tracker is a higher timeframe (HTF) trend tracking indicator designed to help traders identify significant trends, key levels, and market sentiment. The indicator dynamically adapts to the current price action, using HTF highs and lows to display trend direction and strength with detailed visuals.
- Uptrend is identified when the price closes above the HTF high.
- Downtrend is detected when the price closes below the HTF low.
- Midline changes color dynamically based on the trend direction:
- Bullish Green: Indicates an uptrend.
- Bearish Red: Indicates a downtrend.
- Historic HTF highs and lows are displayed as dotted lines.
- Current active HTF high and low levels are shown as solid lines.
- Timeframe labels (e.g., "1D High" or "1D Low") mark the active levels for clarity.
- A green checkmark (✓) is plotted when an uptrend starts.
- A red cross (✕) appears when a downtrend begins.
- Candle colors change dynamically based on the trend and the price's distance from the midline:
- Intense Bullish Green: Price is far above the midline during an uptrend.
- Intense Bearish Red: Price is far below the midline during a downtrend.
- Neutral Gray: Price is near the midline.
- Users can customize the colors to suit their preferences.
🔵Usage:
- Identify uptrends and downtrends using the midline's color and the position of the close relative to the HTF levels.
- Use solid lines and timeframe labels to track current HTF high and low levels.
- Observe dotted lines for historical HTF levels to understand past price behavior.
- Watch for checkmark (✓) and cross (✕) signals to spot trend changes and key market shifts.
How traders can use it
Use HTF Trend Tracker as a chart context layer inside TradingView: read the structure it highlights, compare it with your market bias, and let the script narrow which moves deserve attention.
The strongest workflow is to combine the script with higher timeframe structure, volume context, and a repeatable execution plan instead of treating any single label as a standalone trade.