What this TradingView script does
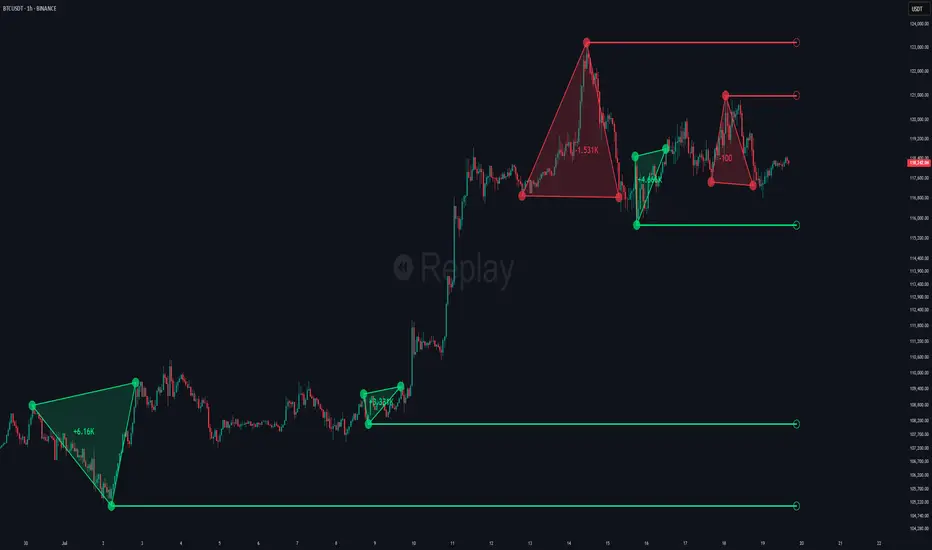
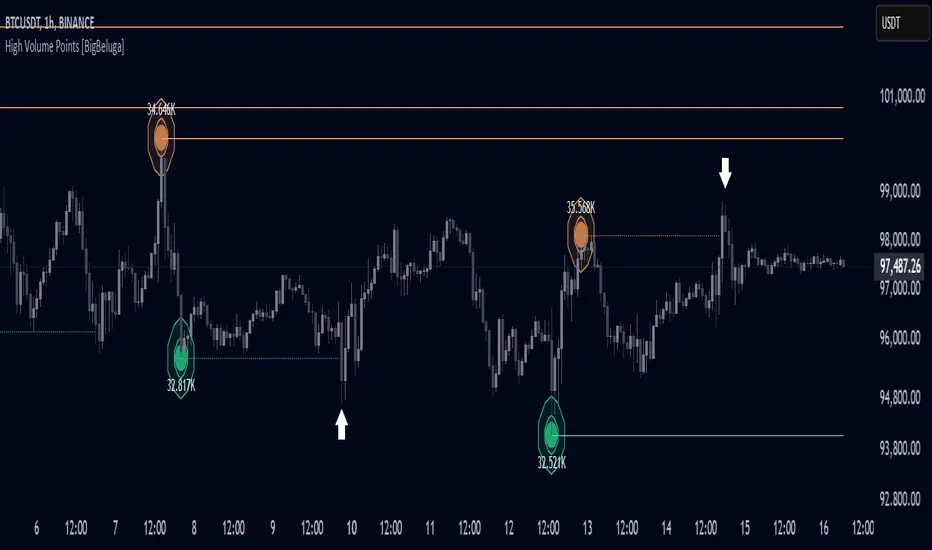
Impulse Profile Zones is a volume-based tool designed to highlight high-impact candles and visualize hidden liquidity zones inside them using microstructure data. It’s ideal for identifying volume concentration and potential reaction points during impulsive market moves.
Whenever a candle exceeds a specified size threshold, this indicator captures its structure and overlays a detailed intrabar volume profile (from a 10x lower timeframe), allowing traders to analyze the distribution of interest within powerful market impulses.
🔵 CONCEPTS
- Filters candles that exceed a user-defined threshold by size.
- For qualifying candles, retrieves lower timeframe price and volume data.
- Divides the candle’s body into 10 volume bins and calculates the volume per zone.
- Highlights the bin with the highest volume as the Point of Control (POC).
- Each POC line extends forward until a new impulse is detected.
🔵 FEATURES
- Impulse Candle Detection: Triggers only when a candle’s body size is larger than the defined threshold.
- Lower Timeframe Profiling: Aggregates 10-bin volume data from a lower timeframe (typically 1/10 of current TF).
How traders can use it
Use Impulse Profile Zones as a chart context layer inside TradingView: read the structure it highlights, compare it with your market bias, and let the script narrow which moves deserve attention.
The strongest workflow is to combine the script with higher timeframe structure, volume context, and a repeatable execution plan instead of treating any single label as a standalone trade.