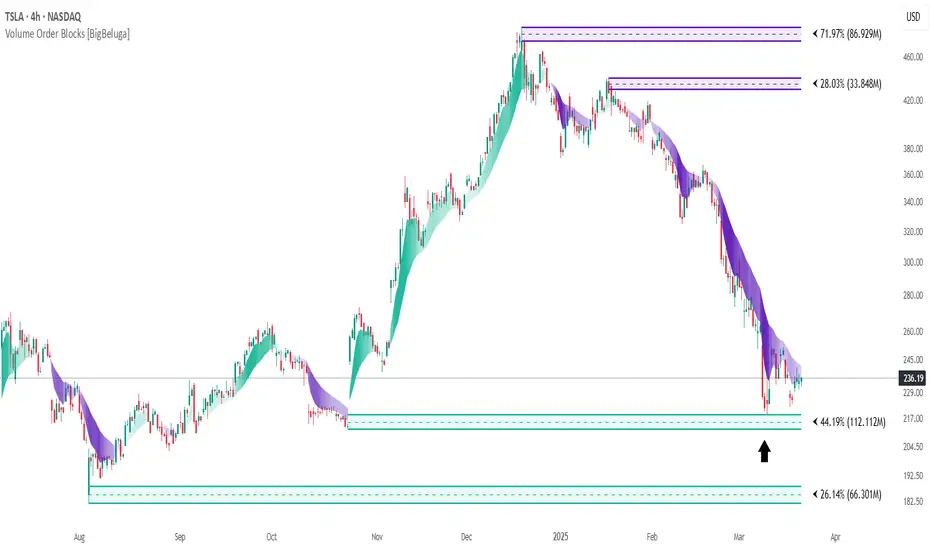
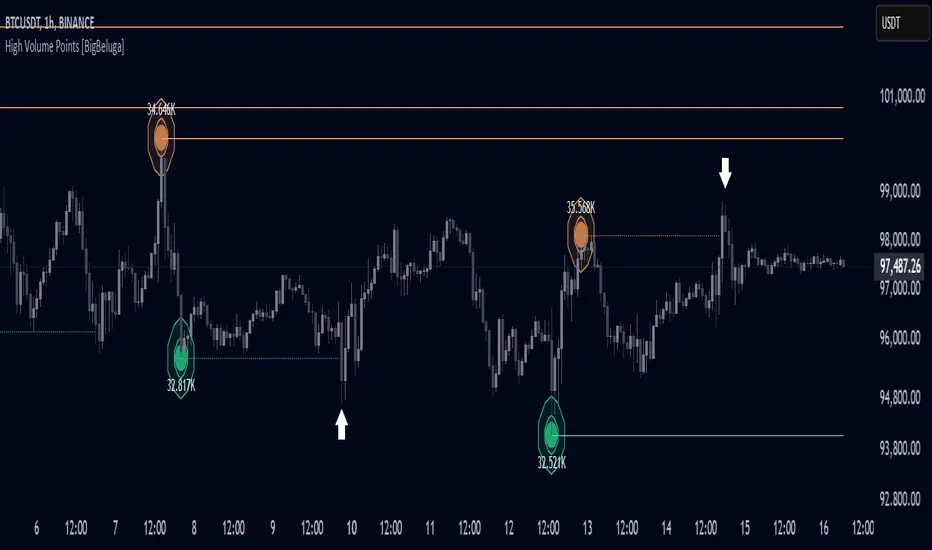
What this TradingView script does
The Liquidity Heatmap is an indicator designed to spot possible resting liquidity or potential stop loss using volume or Open interest.
The Open interest is the total number of outstanding derivative contracts for an asset—such as options or futures—that have not been settled. Open interest keeps track of every open position in a particular contract rather than tracking the total volume traded.
The Volume is the total quantity of shares or contracts traded for the current timeframe.
🔶 HOW IT WORKS Based on the user choice between Volume or OI, the idea is the same for both. On each candle, we add the data (volume or OI) below or above (long or short) that should be the hypothetical liquidation levels; More color of the liquidity level = more reaction when the price goes through it.
Gradient color is calculated between an average of 2 points that the user can select. For example: 500, and the script will take the average of the highest data between 500 and 250 (half of the user's choice), and the gradient will be based on that.
If we take volume as an example, a big volume spike will mean a lot of long or short activity in that candle. A liquidity level will be displayed below/above the set leverage (4.5 = 20x leverage as an example) so when the price revisits that zone, all the 20x leverage should be liquidated.
Huge volume = a lot of activity Huge OI = a lot of positions opened
More volume / OI will result in a stronger color that will generate a stronger reaction.
🔶 ROUTE Here's an example of a route for long liquidity:
Enable the filter = consider only green candles. Set the leverage to 4.5 (20x). Choose Data = Volume. Process:
How traders can use it
Use Liquidity Heatmap as a chart context layer inside TradingView: read the structure it highlights, compare it with your market bias, and let the script narrow which moves deserve attention.
The strongest workflow is to combine the script with higher timeframe structure, volume context, and a repeatable execution plan instead of treating any single label as a standalone trade.