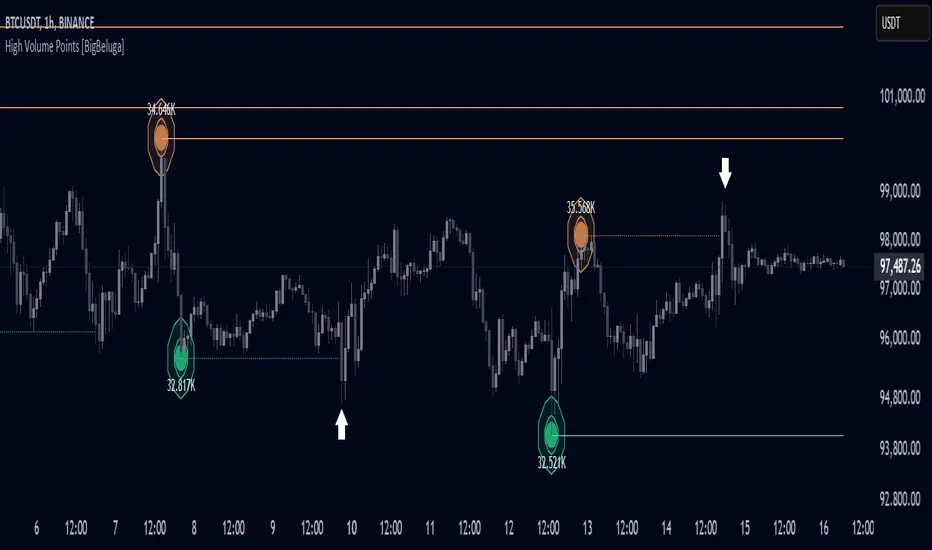
What this TradingView script does
The Liquidity Sweep Hunter is a smart, volume-aware charting tool that automatically detects major support and resistance levels. Unlike basic horizontal line indicators that just draw lines on every swing high or low, this script filters levels based on volume strength. It identifies the "heavy" levels where big money has clearly participated, projects them forward as active boundaries, and alerts you the exact moment price "sweeps" through them.
🔵 FEATURES The system works by tracking the relationship between price pivots and real-time volume:
1 — Volume-Weighted Level Detection
- Smart Pivot Filtering: The engine identifies price pivots (Length) but only confirms a level if the volume at that pivot exceeds your defined Filter threshold. This ignores "weak" pivots and keeps your focus only on high-conviction zones.
- Dynamic Intensity Engine: The indicator automatically changes the look of the lines based on volume. Levels created with higher volume activity get thicker lines (Max Line Width) and higher opacity, making them visually stand out more on your chart.
2 — Automated Liquidity Sweep & Break Logic
- Sweep Alerts (✔): When the price briefly dips below a support level (or spikes above a resistance level) and then closes back inside, the indicator plots a checkmark (✔) to identify the "liquidity sweep."
- Smart Self-Cleaning: If the price candles break directly through a support or resistance line, the indicator detects the structural breach, changes the line to a dotted style, and removes it from your active list. This keeps your chart free of outdated, broken levels.
🔵 HOW TO USE This tool is designed to help you trade based on where market participants have placed their stops and orders:
- Identify High-Volume Anchors: Use the thick, bold lines to spot the most important support and resistance levels on your timeframe. These are the zones where the script detected significant institutional interest.
How traders can use it
Use Liquidity Sweep Hunter as a chart context layer inside TradingView: read the structure it highlights, compare it with your market bias, and let the script narrow which moves deserve attention.
The strongest workflow is to combine the script with higher timeframe structure, volume context, and a repeatable execution plan instead of treating any single label as a standalone trade.