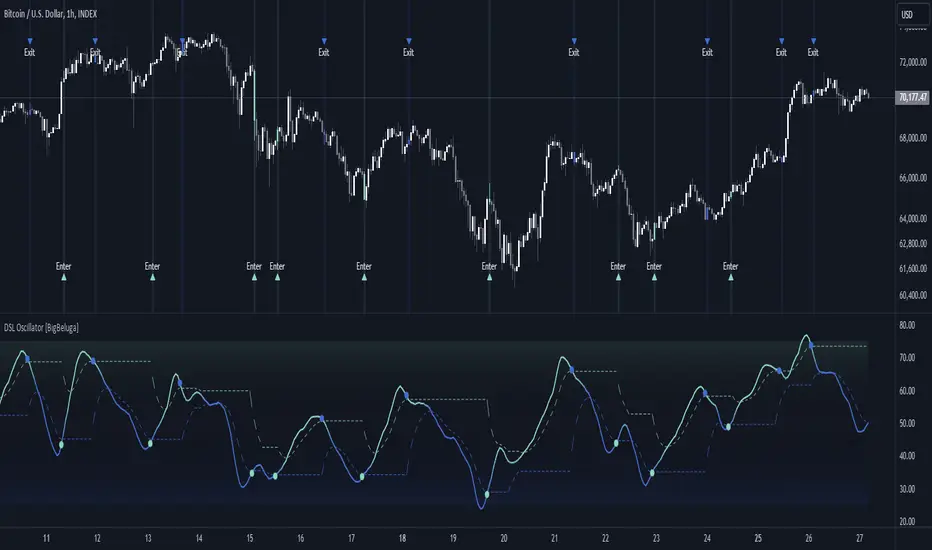
What this TradingView script does
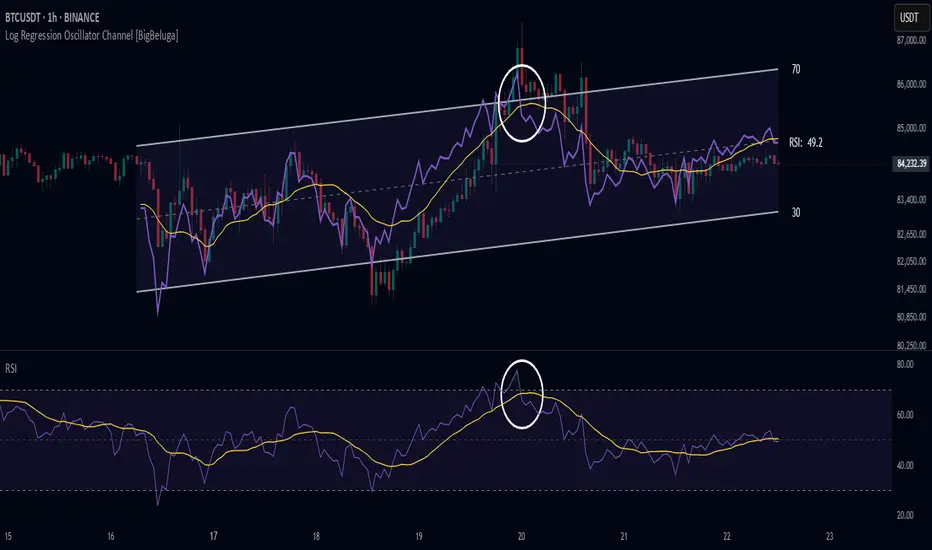
This unique overlay tool blends logarithmic trend analysis with dynamic oscillator behavior. It projects RSI, MFI, or Stochastic lines directly into a log regression channel on the price chart — offering an intuitive way to detect overbought/oversold momentum within the broader price structure.
🔵Key Features:
- Logarithmic Regression Channel: ➣ Draws a trend-based channel using logarithmic regression, adapting to price growth curvature over time. ➣ Features upper, lower, and optional midline boundaries to visualize trend flow and range extremes.
- Oscillator Overlay (RSI / MFI / Stochastic): ➣ Projects your chosen oscillator inside the channel using dynamic polylines. ➣ Allows switching between RSI, Money Flow Index, or Stochastic for versatile momentum insight.
- Threshold-Based Scaling: ➣ The top and bottom of the channel represent traditional oscillator thresholds (e.g., RSI 70/30). ➣ Users can modify the scale in settings to customize what "overbought" or "oversold" means visually.
- Signal Line Integration: ➣ Adds a yellow moving average (signal line) for smoother confirmation of oscillator turns. ➣ Helps identify divergence, momentum shifts, and fakeouts with better clarity.
- Live Oscillator Readout: ➣ Displays the real-time oscillator value at the right edge of the chart. ➣ Ensures traders stay aware of current momentum levels without switching panels.
🔵Usage:
- Momentum Context: ➣ When the oscillator touches the upper regression band, it may signal local overbought pressure. ➣ Touching the lower band may indicate oversold conditions within the current log trend.
- Divergence Detection: ➣ Use the oscillator’s behavior relative to the channel slope to spot divergence from price. ➣ For example, RSI rising inside a falling channel can flag early trend shifts.
How traders can use it
Use Log Regression Oscillator Channel as a chart context layer inside TradingView: read the structure it highlights, compare it with your market bias, and let the script narrow which moves deserve attention.
The strongest workflow is to combine the script with higher timeframe structure, volume context, and a repeatable execution plan instead of treating any single label as a standalone trade.