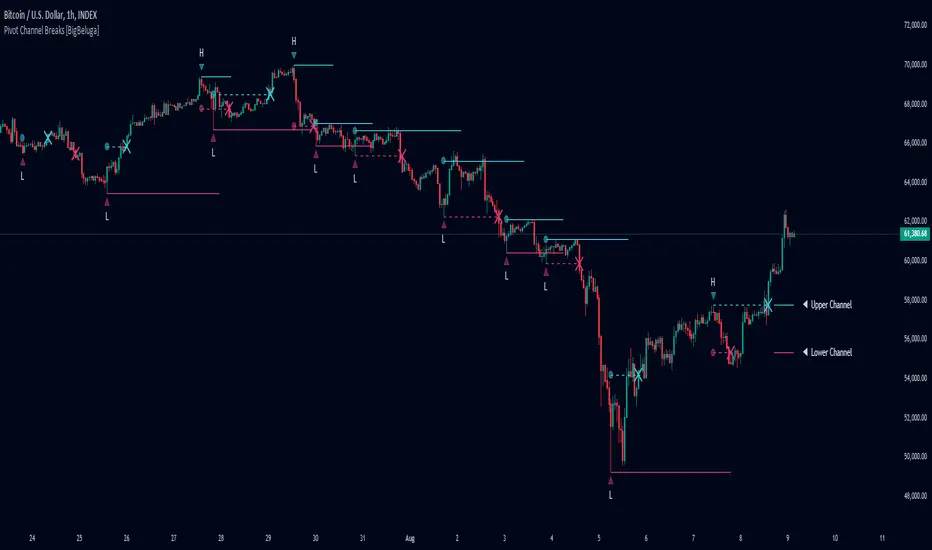
What this TradingView script does
RSI Volatility Suppression Zones is an advanced indicator that identifies periods of suppressed RSI volatility and visualizes these suppression zones on the main chart. It also highlights breakout dynamics, giving traders actionable insights into potential market momentum.
🔵Key Features:
- Detection of Suppression Zones:
- Identifies periods where RSI volatility is suppressed and marks these zones on the main price chart.
- Breakout Visualization:
- When the price breaks above the suppression zone, the box turns aqua, and an upward label is drawn to indicate a bullish breakout.
- If the price breaks below the zone, the box turns purple, and a downward label is drawn for a bearish breakout.
- Breakouts accompanied by a "+" label represent strong moves caused by short-lived, tight zones, signaling significant momentum.
- Wave Labels for Consolidation:
- If the suppression zone remains unbroken, a "wave" label is displayed within the gray box, signifying continued price stability within the range.
- Gradient Intensity Below RSI:
- A gradient strip below the RSI line increases in intensity based on the duration of the suppressed RSI volatility period.
- This visual aid helps traders gauge how extended the low volatility phase is.
🔵Usage:
How traders can use it
Use RSI Volatility Suppression Zones as a chart context layer inside TradingView: read the structure it highlights, compare it with your market bias, and let the script narrow which moves deserve attention.
The strongest workflow is to combine the script with higher timeframe structure, volume context, and a repeatable execution plan instead of treating any single label as a standalone trade.