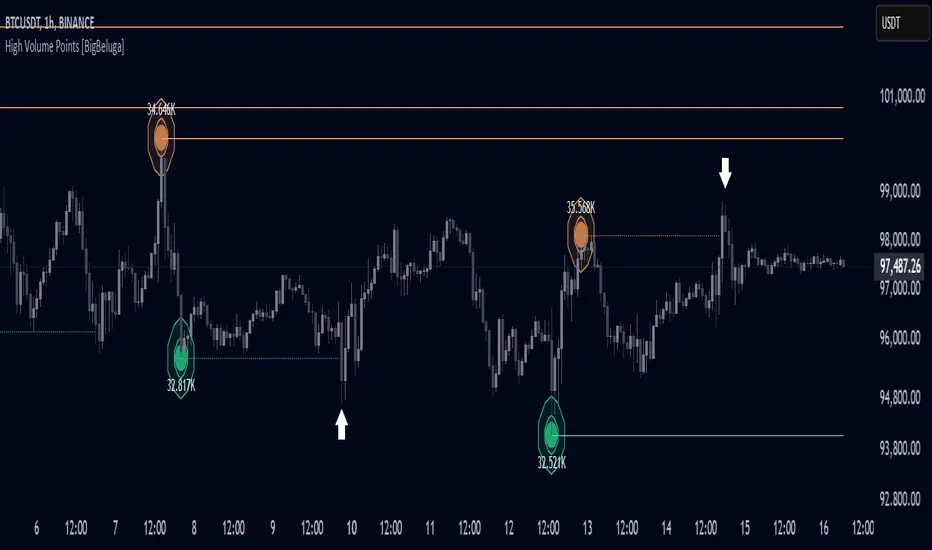
What this TradingView script does
This indicator is a suite of tools that aims to provide traders with efficient metrics to analyze the market in a different way, such as various types of Open Interest, Intraday Volume, and Liquidations.
This indicator can both save time and also provide a different approach to the usual price action trading style.
🔶 FEATURES
The indicator contains the following features:
- Delta OI
- Net longs and shorts
- OI Relative Strength Index
- Bullish and Bearish LTF Volume
- CVD
- Delta Volume
- Long and Short Liquidations
- Cumulative Liquidations
🔶 EXAMPLE OF SUITE
In the example above, we can see how we can plot long and short positions, both opening and closing out.
This can give a unique way to view which side is the strongest but also which side has the most resting liquidity.
How traders can use it
Use Open Intrest / Volume / Liquidations (Suite) as a chart context layer inside TradingView: read the structure it highlights, compare it with your market bias, and let the script narrow which moves deserve attention.
The strongest workflow is to combine the script with higher timeframe structure, volume context, and a repeatable execution plan instead of treating any single label as a standalone trade.