

What this TradingView script does
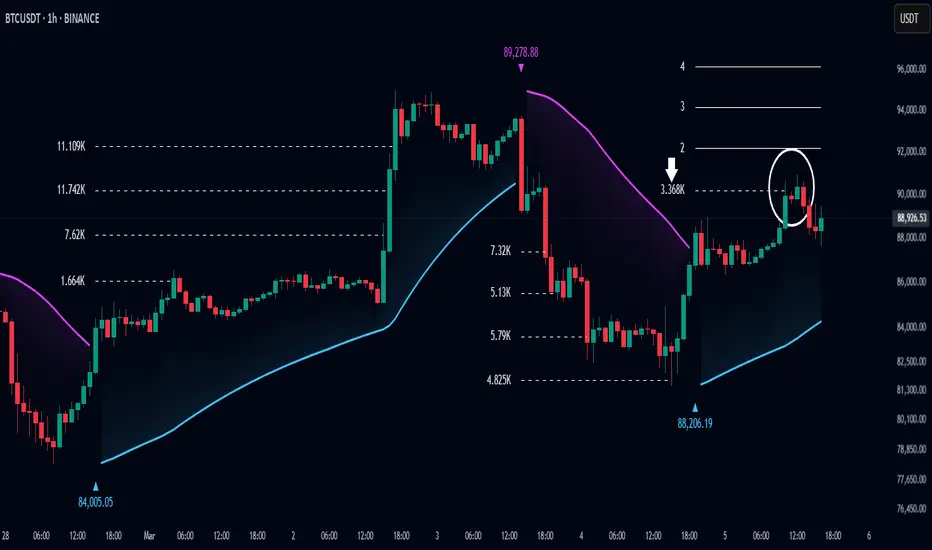
Parabolic SAR + Deviation is an enhanced Parabolic SAR indicator designed to detect trends while incorporating deviation levels and trend change markers for added depth in analyzing price movements.
🔵Key Features:
> Parabolic SAR with Optimized Settings:
- Built on the classic Parabolic SAR, this version uses predefined default settings to enhance its ability to detect and confirm trends.
- Clear trend direction is indicated by smooth trend lines, allowing traders to easily visualize market movements.
- Trend Change Markers:
- When a trend change occurs based on the SAR, the indicator plots a triangle at the trend change point.
- The triangle is accompanied by the price value of the trend change, allowing traders to identify key reversal points instantly.
> Deviation Levels:
- Four deviation levels are automatically plotted when a trend change occurs (up or down).
- Uptrend: Deviation levels are positioned above the entry point.
- Downtrend: Deviation levels are positioned below the entry point.
- Levels are labeled with numbers 1 to 4, representing increasing degrees of deviation. > Dynamic Level Updates:
- When the price crosses a deviation level, the level becomes dashed and its label changes to display the volume at the breakout point.
How traders can use it
Use Parabolic SAR Deviation as a chart context layer inside TradingView: read the structure it highlights, compare it with your market bias, and let the script narrow which moves deserve attention.
The strongest workflow is to combine the script with higher timeframe structure, volume context, and a repeatable execution plan instead of treating any single label as a standalone trade.


