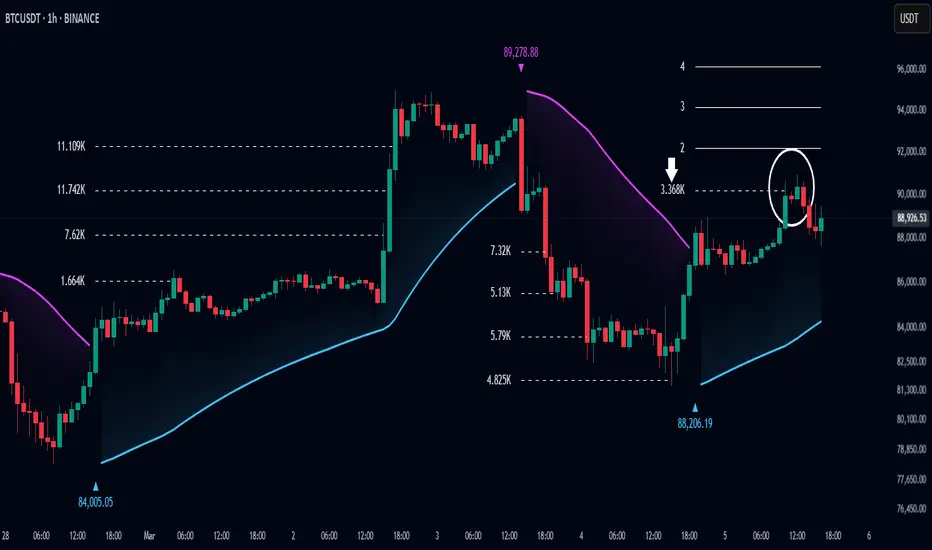
What this TradingView script does
The Volume Delta indicator visualizes the dominance between buying and selling volume within a given period. It calculates the percentage of bullish (buy) versus bearish (sell) volume, then color-codes the candles and provides a real-time dashboard comparing delta values across multiple currency pairs. This makes it a powerful tool for monitoring order-flow strength and intermarket relationships in real time.
🔵 CONCEPTS
- Each bar’s buy volume is counted when the close is higher than the open.
- Each bar’s sell volume is counted when the close is lower than the open.
volumeBuy = 0. volumeSell = 0. for i = 0 to period if close > open volumeBuy += volume else volumeSell += volume
- The indicator sums both over a chosen period to calculate the ratio of buy-to-sell pressure.
- Delta (%) = (Buy Volume ÷ (Buy Volume + Sell Volume)) × 100.
- Gradient colors highlight whether buying or selling pressure dominates.
🔵 FEATURES
- Calculates real-time Volume Delta for the selected chart or for multiple assets.
How traders can use it
Use Volume Delta as a chart context layer inside TradingView: read the structure it highlights, compare it with your market bias, and let the script narrow which moves deserve attention.
The strongest workflow is to combine the script with higher timeframe structure, volume context, and a repeatable execution plan instead of treating any single label as a standalone trade.