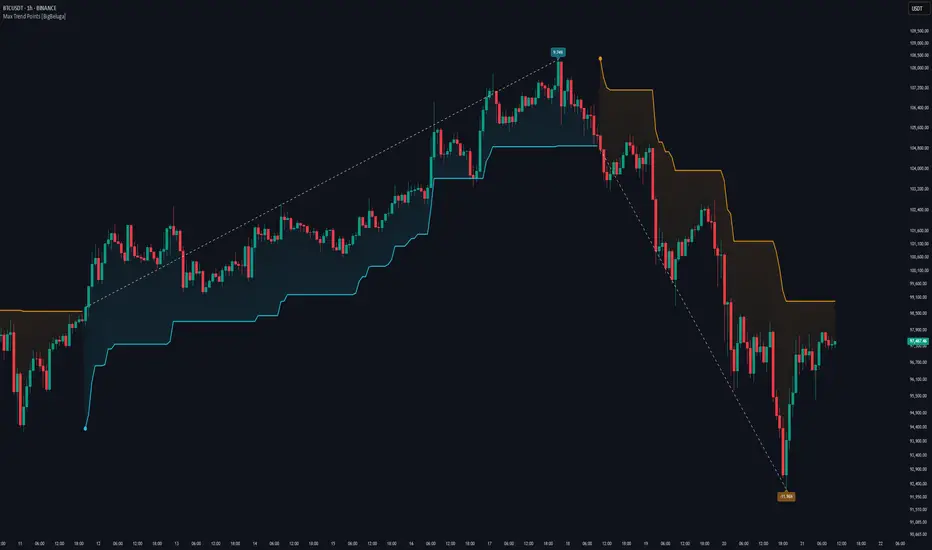
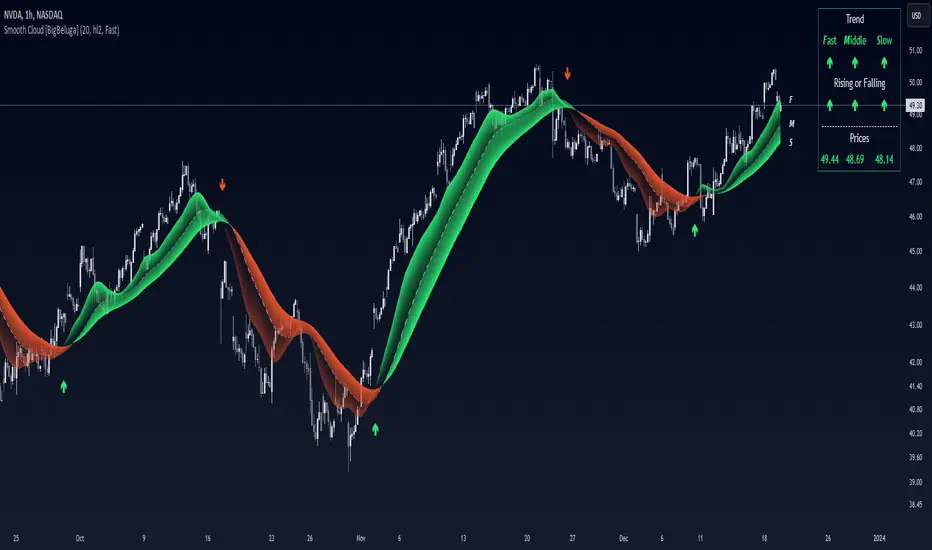
What this TradingView script does
The Percent Trend Change indicator is a trend-following tool that provides real-time percentage changes during trends based on entry prices. Using John Ehlers’ Ultimate Smoother filter, it detects trend direction, identifies uptrends and downtrends, and tracks percentage changes during the trend. Additionally, it has a channel that can be toggled on or off, and the width can be customized, adding an extra visual layer to assess trend strength and direction.
NIFTY50:
META:
🔵 IDEA
The Percent Trend Change indicator helps traders visualize the progression of a trend with percentage changes from entry points. It identifies trends and marks percentage changes during the trend, making it easier to assess the strength and sustainability of the ongoing trend.
The use of John Ehlers' Ultimate Smoother filter helps detect trend changes based on consecutive price movements over five bars, making it highly responsive to short- and medium-term trends.
🔵 KEY FEATURES & USAGE
◉ Ultimate Smoother Filter for Trend Detection: The trend is detected using the Ultimate Smoother filter. If the smoothed line rises five times in a row, the indicator identifies an uptrend. If it falls five times in a row, it identifies a downtrend.
◉ Trend Entry with Price Labels: The indicator marks trend entry points with up (green) and down (red) triangles. These triangles are labeled with the entry price, allowing traders to track the starting price of the trend.
◉ Percentage Change Labels During Trends: During a trend, the indicator periodically plots percentage change labels based on the bar period set in the settings.
How traders can use it
Use Percent Trend Change as a chart context layer inside TradingView: read the structure it highlights, compare it with your market bias, and let the script narrow which moves deserve attention.
The strongest workflow is to combine the script with higher timeframe structure, volume context, and a repeatable execution plan instead of treating any single label as a standalone trade.