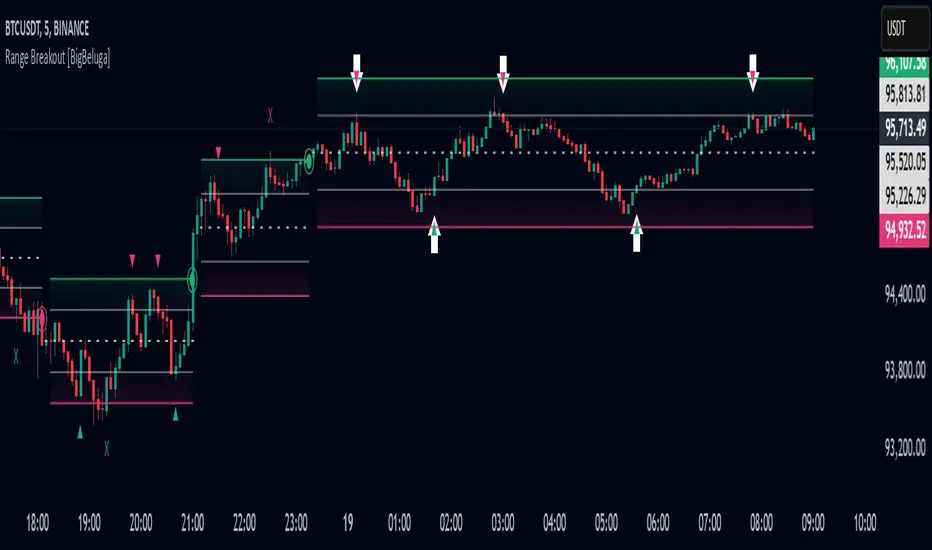
What this TradingView script does
The Volatility Gaussian Bands indicator is a cutting-edge tool designed to analyze market trends and volatility with high precision. By applying a Gaussian filter to smooth price data and implementing dynamic bands based on market volatility, this indicator provides clear signals for trend direction, strength, and potential reversals. With updated volatility calculations, it enhances the accuracy of trend detection, making it a powerful addition to any trader's toolkit.
⮁ KEY FEATURES & USAGE
● Gaussian Filter Trend Bands: The Gaussian Filter forms the foundation of this indicator by smoothing price data to reveal the underlying trend. The trend is visualized through upper and lower bands that adjust dynamically based on market volatility. These bands provide clear visual cues for traders: a crossover above the upper band indicates a potential uptrend, while a cross below the lower band signals a potential downtrend. This feature allows traders to identify trends with greater accuracy and act accordingly.
● Dynamic Trend Strength Gauges: The indicator includes trend strength gauges positioned at the top and bottom of the chart. These gauges dynamically measure the strength of the uptrend and downtrend, based on the middle Gaussian line. Even if the trend is downward, a rising midline will cause the upward trend strength gauge to show an increase, offering a nuanced view of the market’s momentum.
Weakening of the trend:
● Fast Trend Change Indicators: Triangles with a "+" symbol appear on the chart to signal rapid changes in trend direction. These indicators are particularly useful when the trend changes swiftly while the midline continues to grow in its previous direction. For instance, during a downtrend, if the trend suddenly shifts upward while the midline is still declining, a triangle with a "+" will indicate this quick reversal. This feature is crucial for traders looking to capitalize on rapid market movements.
● Retest Signals: Retest signals, displayed as triangles, highlight potential areas where the price may retest the Gaussian line during a trend. These signals provide an additional layer of analysis, helping traders confirm trend continuations or identify possible reversals. The retest signals can be customized based on the trader’s preferences.
⮁ CUSTOMIZATION
● Length Adjustment: The length of the Gaussian filter can be customized to control the sensitivity of trend detection. Shorter lengths make the indicator more responsive, while longer lengths offer a smoother, more stable trend line.
● Volatility Calculation Mode: Traders can select from different modes (AVG, MEDIAN, MODE) to calculate the Gaussian filter, allowing for flexibility in how trends are detected and analyzed.
How traders can use it
Use Volatility Gaussian Bands as a chart context layer inside TradingView: read the structure it highlights, compare it with your market bias, and let the script narrow which moves deserve attention.
The strongest workflow is to combine the script with higher timeframe structure, volume context, and a repeatable execution plan instead of treating any single label as a standalone trade.