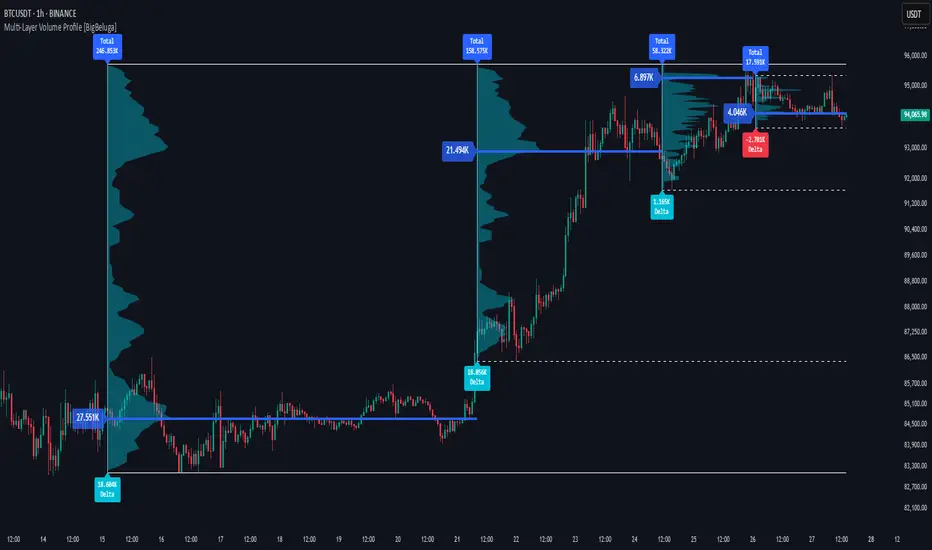
What this TradingView script does
🔵Delta Volume Profile A dynamic volume analysis tool that builds two separate horizontal profiles: one for bullish candles and one for bearish candles. This indicator helps traders identify the true balance of buying vs. selling volume across price levels, highlighting points of control (POCs), delta dominance, and hidden volume clusters with remarkable precision.
🔵 KEY FEATURES
Split Volume Profiles (Bull vs. Bear): The indicator separates volume based on candle direction:
- If close > open, the candle’s volume is added to the bullish profile (positive volume).
- If close < open, it contributes to the bearish profile (negative volume).
ATR-Based Binning: The price range over the selected lookback is split into bins using ATR(200) as the bin height. Each bin accumulates both bull and bear volumes to form the dual-sided profile.
Bull and Bear Volume Bars:
- Bullish volumes are shown as right-facing bars on the right side, colored with a bullish gradient.
- Bearish volumes appear as left-facing bars on the left side, shaded with a bearish gradient.
- Each bar includes a volume label (e.g., +12.45K or -9.33K) to show exact volume at that price level.
- Points of Control (POC) Highlighting: The bin with the highest bullish volume is marked with a border in POC+ color (default: blue). The bin with the highest bearish volume is marked with a POC− color (default: orange).
- Total Volume Density Map: A neutral gray background box is plotted behind candles showing the total volume (bull + bear) per bin. This reveals high-interest price zones regardless of direction.
Delta and Total Volume Summary:
How traders can use it
Use Delta Volume Profile as a chart context layer inside TradingView: read the structure it highlights, compare it with your market bias, and let the script narrow which moves deserve attention.
The strongest workflow is to combine the script with higher timeframe structure, volume context, and a repeatable execution plan instead of treating any single label as a standalone trade.