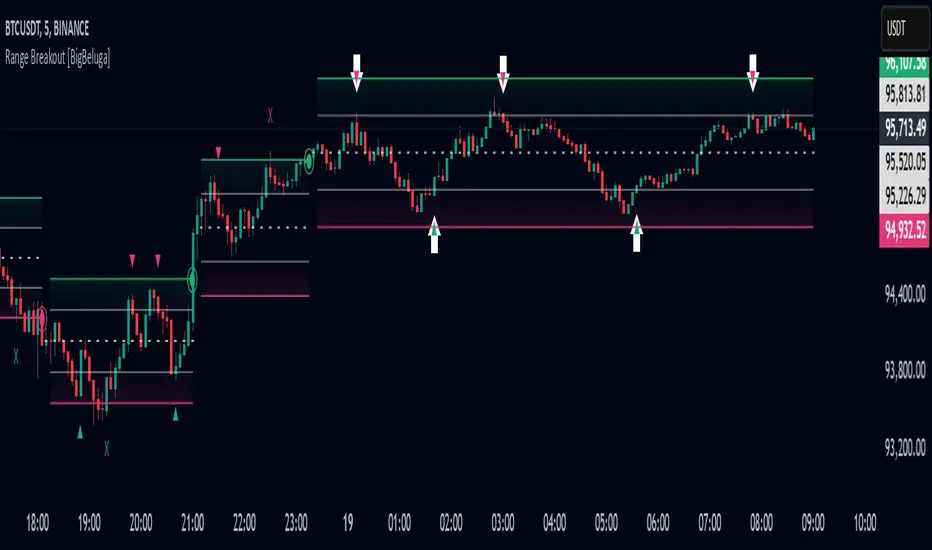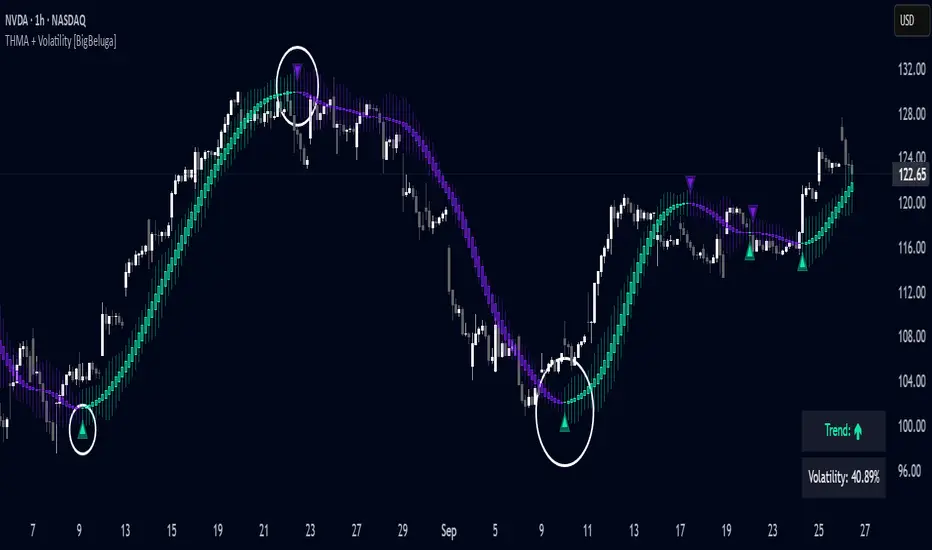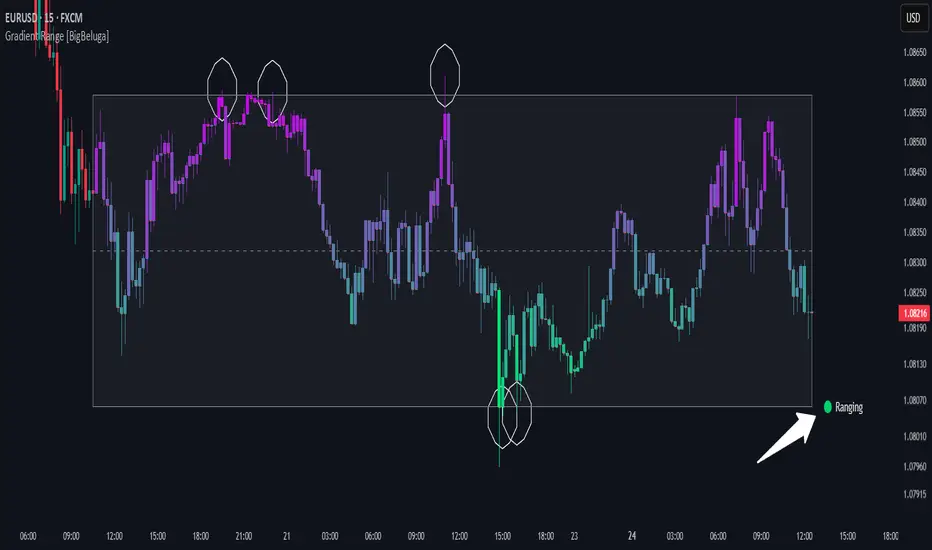
What this TradingView script does
Low Volatility Range Breaks
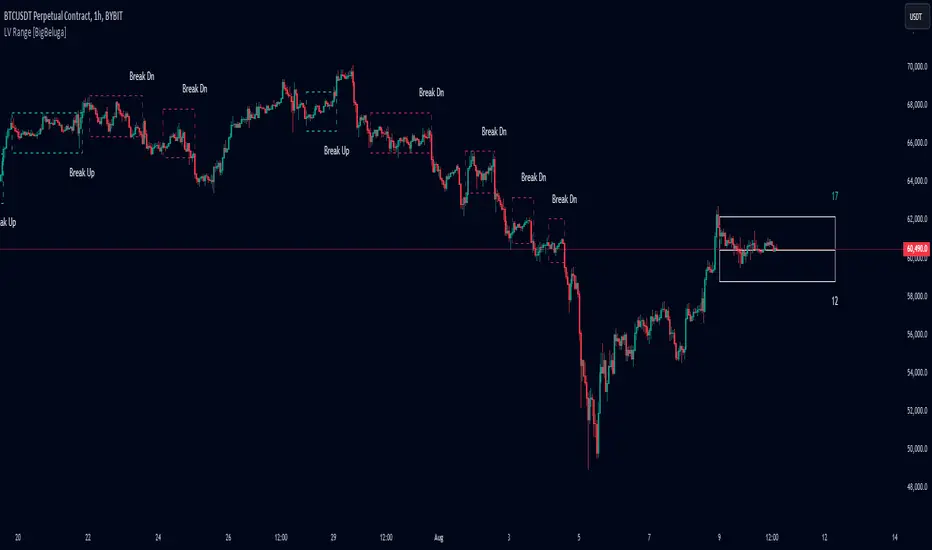
The Low Volatility Range Breaks indicator is an advanced technical analysis tool designed to identify periods of low volatility and potential breakout opportunities. By visualizing low volatility ranges as ranges and tracking subsequent price movements, this indicator helps traders spot potential potential trade setups.
🔵KEY FEATURES
● Low Volatility Detection
- Identifies periods of low volatility based on highest and lowest periods and user-defined sensitivity
- Uses a combination of highest/lowest price calculations and ATR for dynamic adaptation
● Volatility Box Visualization
- Creates a box to represent the low volatility range
- Box height is adjustable based on ATR multiplier
- Includes a mid-line for reference within the box
How traders can use it
Use Low Volatility Range Breaks as a chart context layer inside TradingView: read the structure it highlights, compare it with your market bias, and let the script narrow which moves deserve attention.
The strongest workflow is to combine the script with higher timeframe structure, volume context, and a repeatable execution plan instead of treating any single label as a standalone trade.