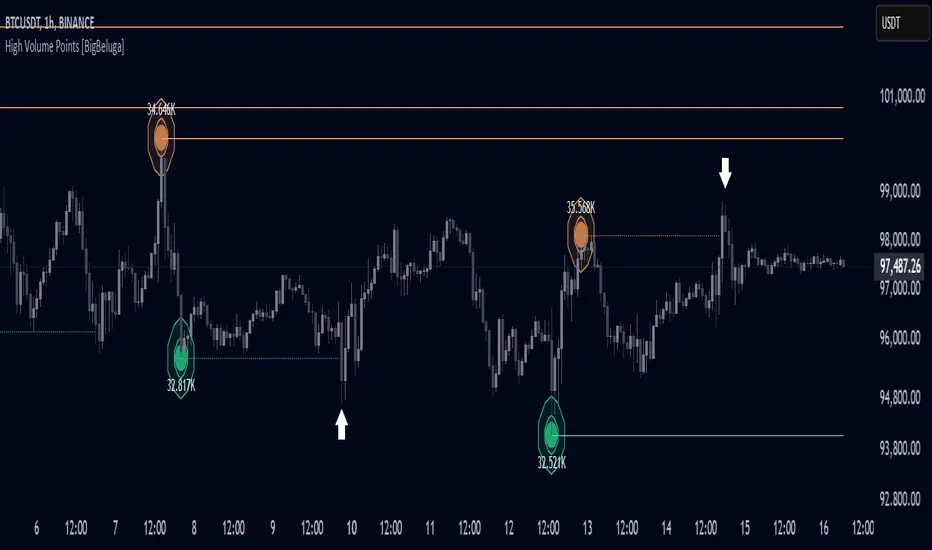
What this TradingView script does
The Pivot Levels indicator automatically detects and draws key market pivot levels across multiple sensitivity settings. Each pivot level represents a significant local high or low in price structure, acting as potential zones of support and resistance. Traders can visualize short-, medium-, and long-term pivot layers simultaneously, helping to identify where price may react, reverse, or break out.
🔵 CONCEPTS
- Different pivot lengths provide multi-length sensitivity on the same timeframe — shorter lengths detect local micro-swings, while longer lengths capture broader swing structure within the current chart.
- ATR-based color logic marks active, bullish, or bearish pivot zones dynamically.
- Lines can extend to the right or both sides to track reactions over time.
🔵 FEATURES
- Detects up to four custom pivot levels simultaneously.
- Each pivot level has independent settings for length, style, and extension mode.
- Auto-colors each pivot as support (green), resistance (orange), or active zone (blue).
- Displays dual-width line layers: a solid base and a transparent overlay for visual depth.
How traders can use it
Use Pivot Levels as a chart context layer inside TradingView: read the structure it highlights, compare it with your market bias, and let the script narrow which moves deserve attention.
The strongest workflow is to combine the script with higher timeframe structure, volume context, and a repeatable execution plan instead of treating any single label as a standalone trade.