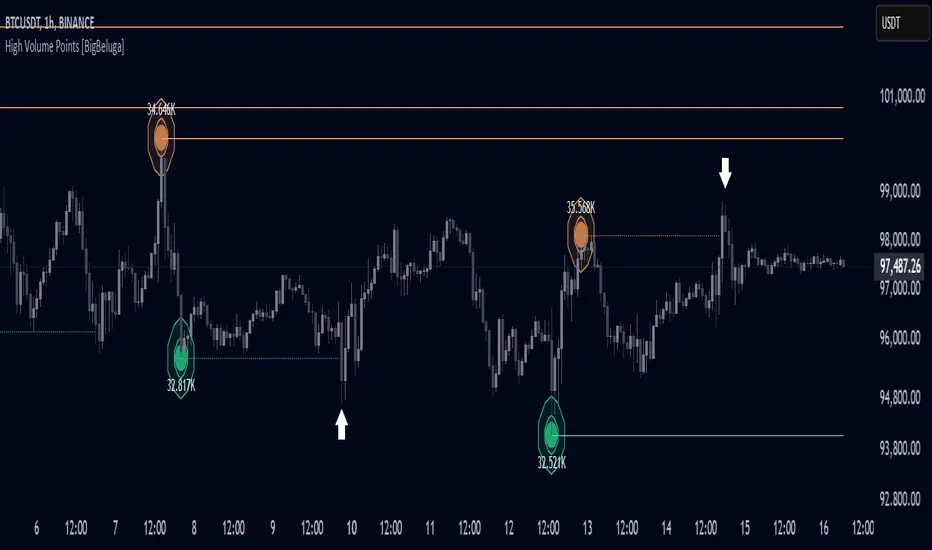
What this TradingView script does
Visible Range Support and Resistance is a dynamic support/resistance tool that analyzes price structure only within the visible range of your chart. It detects key levels based on clustered pivots inside a binned vertical range and highlights zones where price has historically reacted. The tool adjusts in real-time as you pan or zoom, offering adaptive precision at any scale.
🔵 CONCEPTS
- Pivot Clustering: Price highs/lows are collected into horizontal "bins" across the visible chart range. If multiple pivots align within a bin, that area is marked as a potential support or resistance zone.
- Visible Range Only: Calculations are limited strictly to the bars currently visible on the chart. Zooming or panning changes the result.
- Bin System: The visible high-to-low range is divided into 100 horizontal zones (bins) to group pivots and detect confluence.
- Multi-Threshold Detection: Users can enable two separate S/R detection levels with different pivot count thresholds for more nuanced signals. The more pivot points a level has, the thicker and richer the color.
- Directional Context: Labels include arrows (▲ or ▼) to show whether the current price is above (support) or below (resistance) each zone.
- Range Boundaries: The top and bottom of the visible range are marked with dashed lines and labeled as Top Range and Bottom Range.
🔵 FEATURES
- Detects S/R zones based on the number of pivots found within each price bin.
How traders can use it
Use Visible Range Support and Resistance as a chart context layer inside TradingView: read the structure it highlights, compare it with your market bias, and let the script narrow which moves deserve attention.
The strongest workflow is to combine the script with higher timeframe structure, volume context, and a repeatable execution plan instead of treating any single label as a standalone trade.