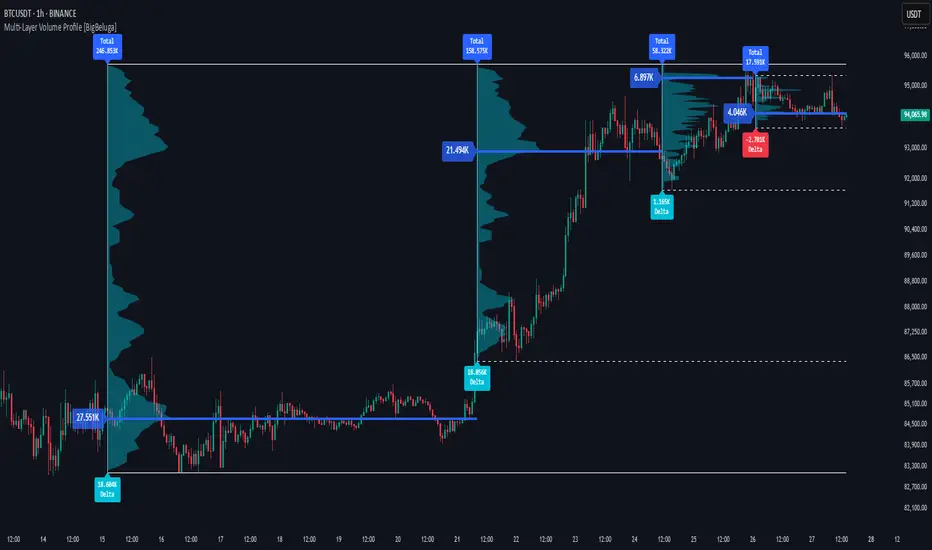
What this TradingView script does
The Quadro Volume Profile is a precision-engineered volume profiling tool that segments market activity into four distinct quadrants surrounding the current price. By separating bullish and bearish volume above and below the current price, it helps traders identify dominant forces and high-interest price zones with ease. Each quadrant includes label annotations showing total volume and its share of overall activity — delivering powerful insights into the market’s internal structure.
🔵 CONCEPTS
- Four-Quadrant Volume Distribution: Volume is separated into Buy and Sell profiles both above and below the current price.
- Directional Volume Logic: Bullish and bearish candle volume is allocated to specific bins, creating color-coded volume stacks.
- Dynamic PoC Detection: Point of Control (PoC) levels are calculated per quadrant and optionally displayed.
- Lookback-Based Anchoring: The volume histogram is anchored to a fixed lookback window, ensuring consistency and historical context.
- Label-Based Analytics: Each quadrant displays a labeled breakdown of direction, total volume, and percentage weight of total activity.
🔵 FEATURES Four separate volume profiles:
- Upper Left: Bearish volume (Sell Quad above price)
- Upper Right: Bullish volume (Buy Quad above price)
How traders can use it
Use Quadro Volume Profile as a chart context layer inside TradingView: read the structure it highlights, compare it with your market bias, and let the script narrow which moves deserve attention.
The strongest workflow is to combine the script with higher timeframe structure, volume context, and a repeatable execution plan instead of treating any single label as a standalone trade.