

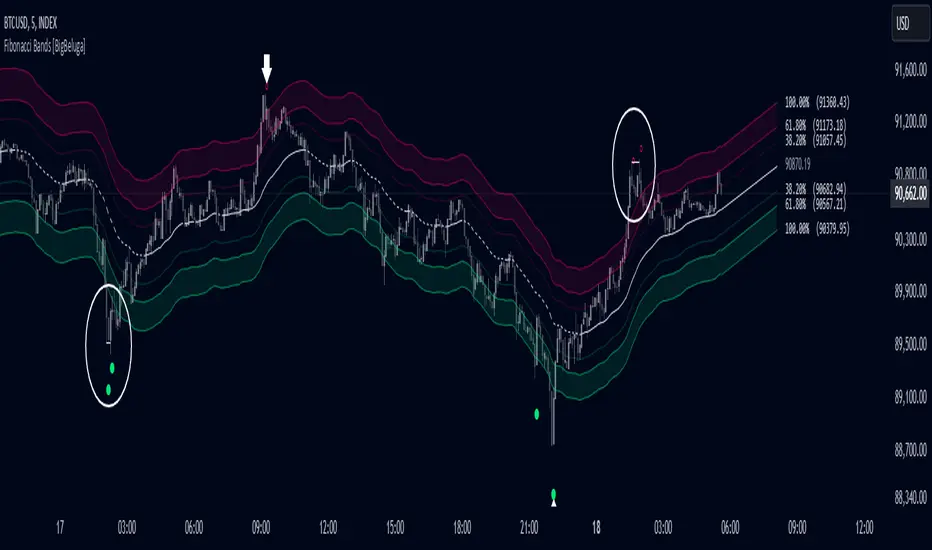
Fibonacci Bands
The Fibonacci Band indicator is a powerful tool for identifying potential support, resistance, and mean reversion zones based on Fibonacci ratios. It overlays three se...
Discover BigBeluga support, resistance, pivot, level, zone, Fibonacci, and price-action scripts for mapping key TradingView areas.
Every Support & Resistance script in the library, searchable by name or tag.
The Fibonacci Band indicator is a powerful tool for identifying potential support, resistance, and mean reversion zones based on Fibonacci ratios. It overlays three se...

The Higher Time Frame Support/Resistance indicator is a tool designed to display pivot points derived from higher timeframes on your current chart. These pivot points...
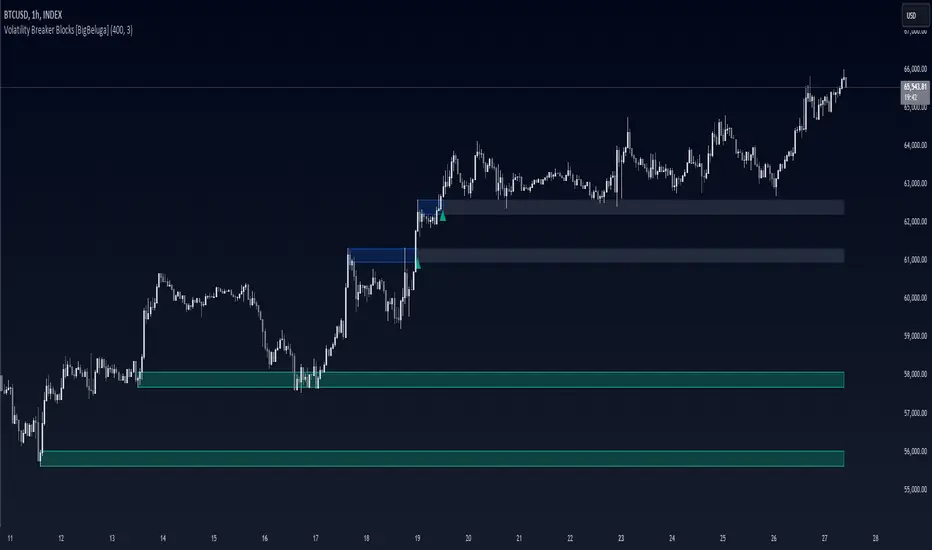
The Volatility Breaker Blocks indicator identifies key market levels based on significant volatility at pivot highs and lows. It plots blocks that act as potential sup...

The Fractal Levels - BigBeluga indicator is a specialized tool that detects significant market highs and lows, ranking them by their normalized volume. This indicator...

THE VOLUMATIC S/R LEVELS The Volumatic S/R Levels is an advanced technical analysis tool designed to identify and visualize significant support and resistance levels...

The Psychological Support/Resistance indicator aims to provide the user with hypothetical support and resistance zones that are likely to provoke a strong reaction in...
Get advanced indicators, backtesting and the BigBeluga community in one plan.