


Supply and Demand Zones
The Supply and Demand Zones indicator automatically identifies institutional order zones formed by high-volume price movements. It detects aggressive buyin...
Browse page 8 of BigBeluga's TradingView indicator, strategy, screener, and trading-tool library with practical guides and chart previews.
Every published script, searchable by name, tag or concept.
The Supply and Demand Zones indicator automatically identifies institutional order zones formed by high-volume price movements. It detects aggressive buyin...

A geometric price mapping tool that projects Fibonacci sequence levels and grid structures from recent price swings to help traders visualize natural expan...

This indicator brings Smart Money Concept (ICT) session logic to life by plotting key global trading sessions with volume and delta analytics. It not only highlights s...

The Historical Returns indicator visualizes daily and monthly return data to help traders assess seasonal performance and volatility behavior. It provides...

HTF Frequency Zone highlights the dominant price level (Point of Control) and the full high–low expansion of any higher timeframe — Daily, Weekly, or Mont...

Trend Step Channel identifies directional bias by forming a dynamic volatility-based step channel. It detects trend shifts when candle lows close above th...

Regime Filter is a dual-factor trend condition tool combining price trend momentum and volume expansion into a single, easy-to-read visual framework. It qu...

The Backtesting System (SMC) is a strategy builder designed around concepts of Smart Money. What makes this indicator unique is that users can build a wide variety of...

Low Volatility Profiles is a market compression and breakout-anticipation tool that identifies phases of low volatility using ADX and then builds a real-t...

The Directional Imbalance Index is designed to track market strength by counting how often price sets new highs or lows over a defined lookback period. Ev...

The Swing Traces indicator identifies significant swing points in the market and extends them forward as fading traces. These traces represent the memory o...
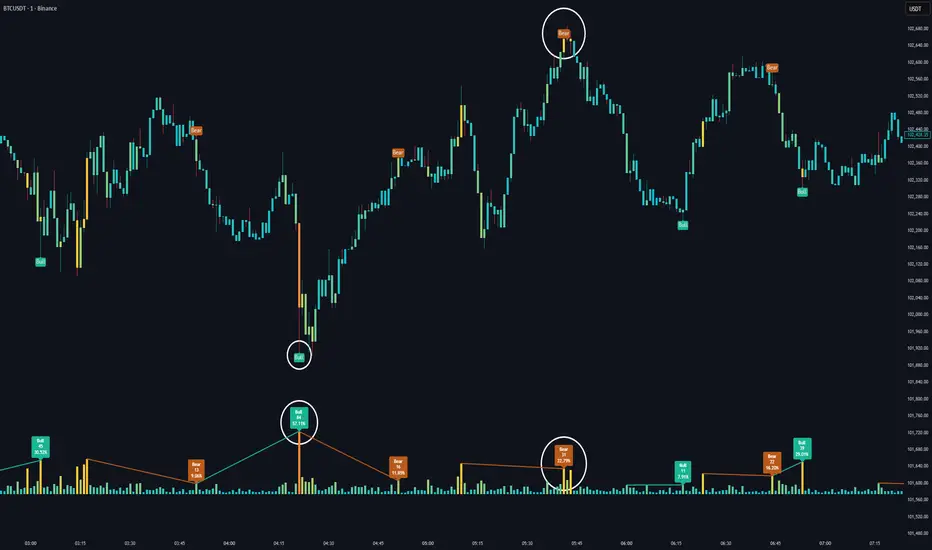
The Volume HeatMap Divergence is a smart volume visualization tool that overlays normalized volume data directly on the chart. Using a color heatmap from a...
Get advanced indicators, backtesting and the BigBeluga community in one plan.